Summary
In this project, our group developed an interactive and reactive application that enables customers to learn more about wines and recommends wines that meet their preference, using R shiny app. We strongly believe that this application will enhance customers’ experience when they learn and choose wines to buy. This application demonstrates and showcases our ability to utilize analytical techniques such as descriptive and prescriptive analytics and various R libraries to creat dashboards that impact customers’ experience in positive way.
- Tools / Libraries used: R / shiny, dplyr, ggplot2
What we have created
R shiny library can be a powerful tool when we need to build dashboards. The function of our WineR application can be divided into three parts, utilizing descriptive and prescriptive analytic techniques.
[Click the image below to visit the App!]
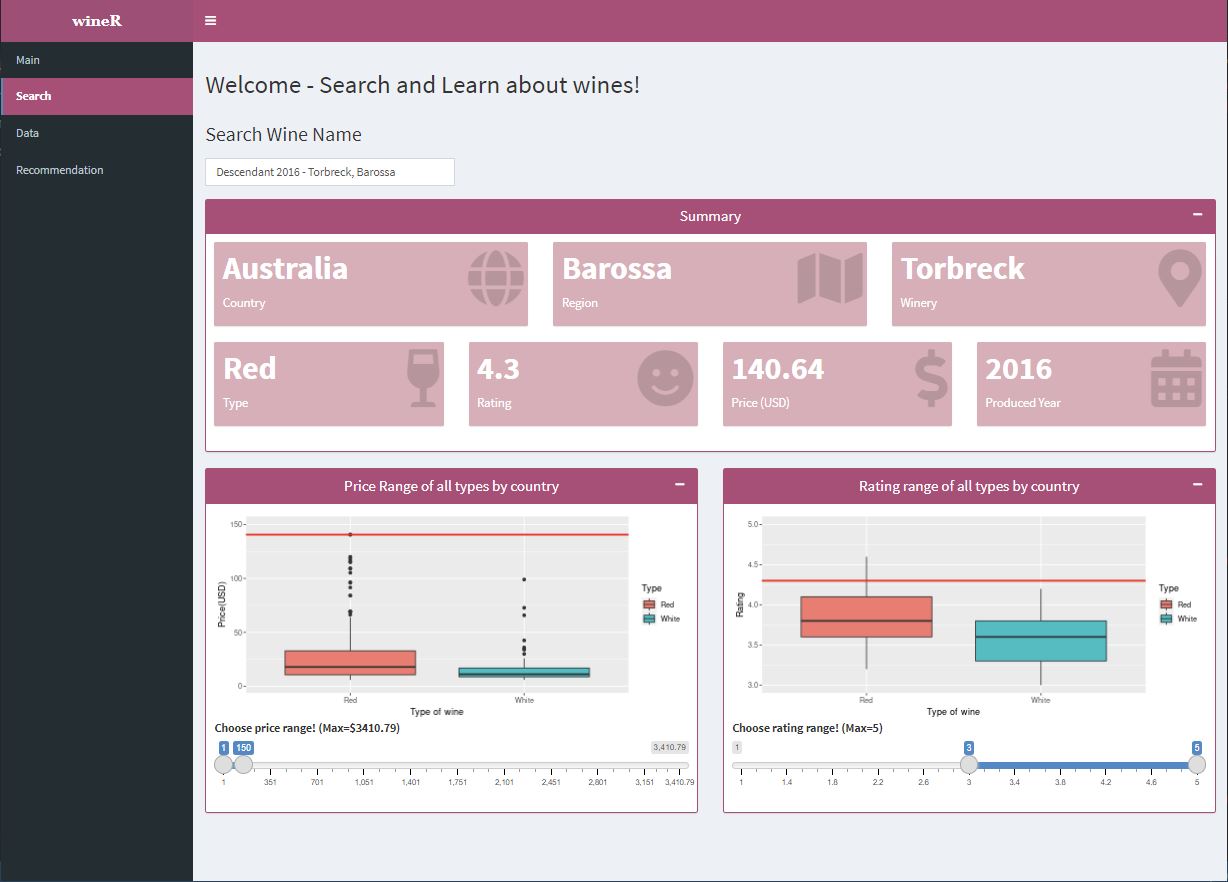
Search Wines: Descriptive Analysis
- By leveraging dplyr and ggplot2, we created an interactive dashboard that shows key information about wines, price and rating statistics, and positions of those wines upon the wines that users manaully search on the search bar.
[Search Wines Page]
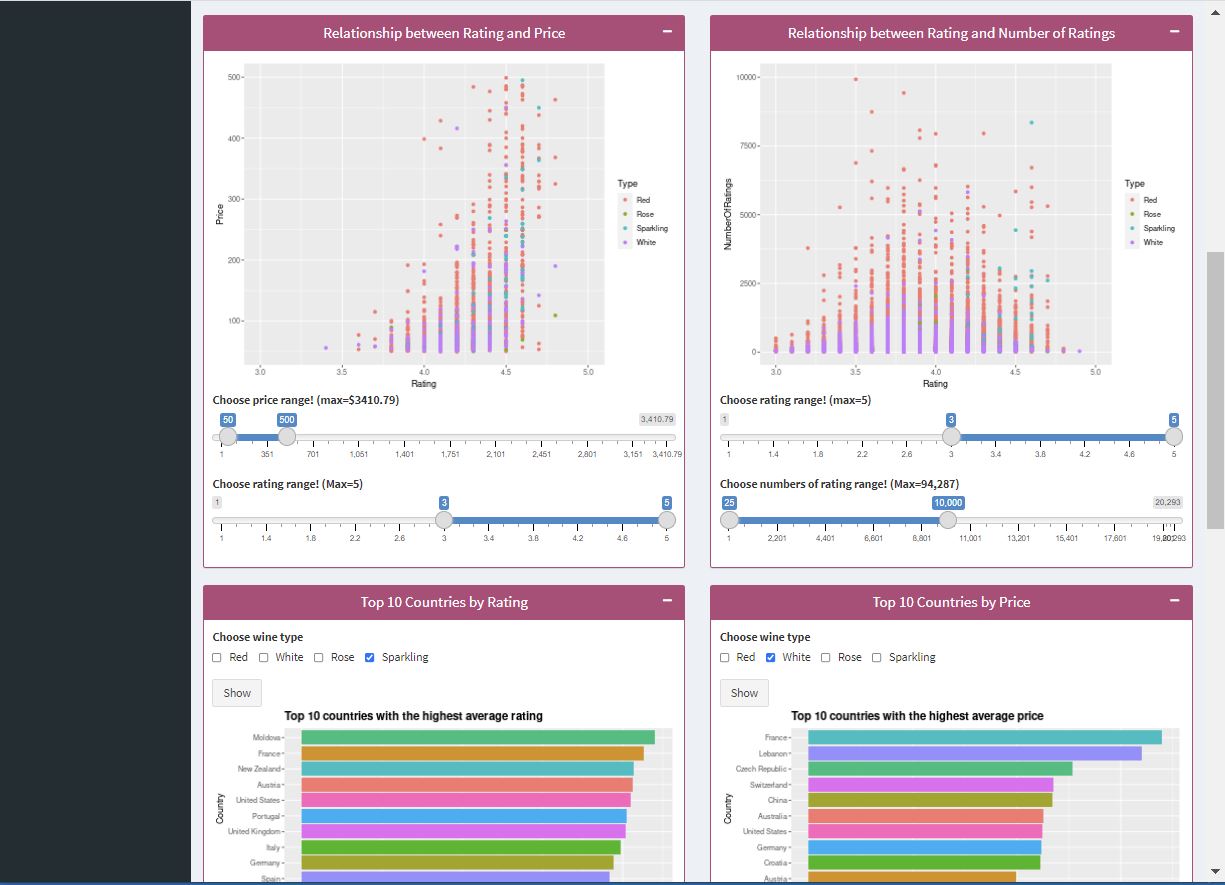
Get Insights About Wines: Descriptive Analysis
- We built 11 key graphs that describe relationships between various factors of wines.
[Get Insights Page]
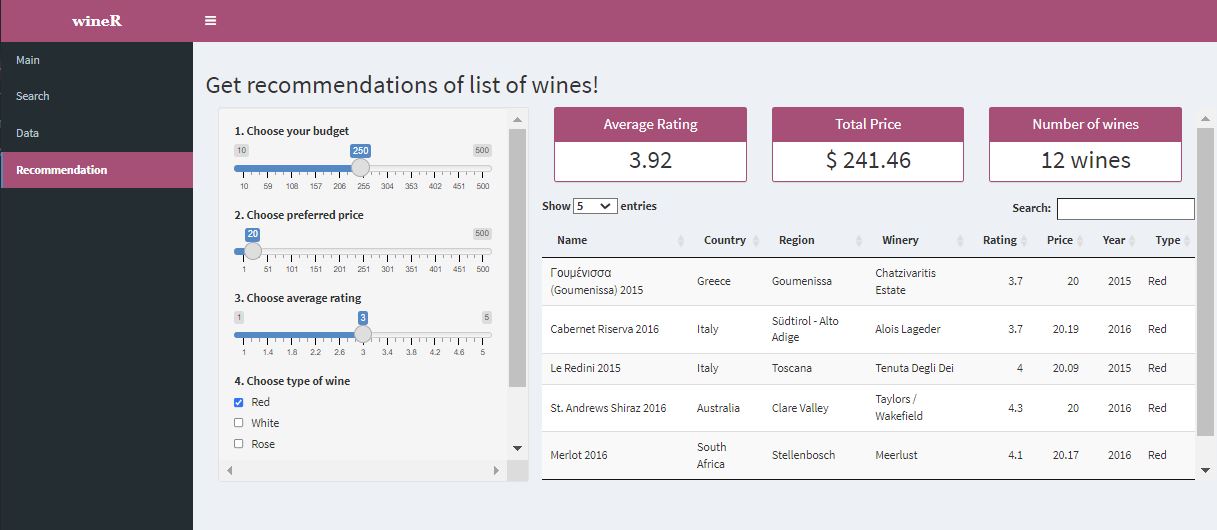
Get Wine Recommendations: Prescriptive Analysis
- Finally, we utilized optimization packages to build an interactive dashboard which allows customers to select their budget, preferred price and average ratings to give recommendation of wines in our database that satisfy the constraints.
[Get Recommendation Page]
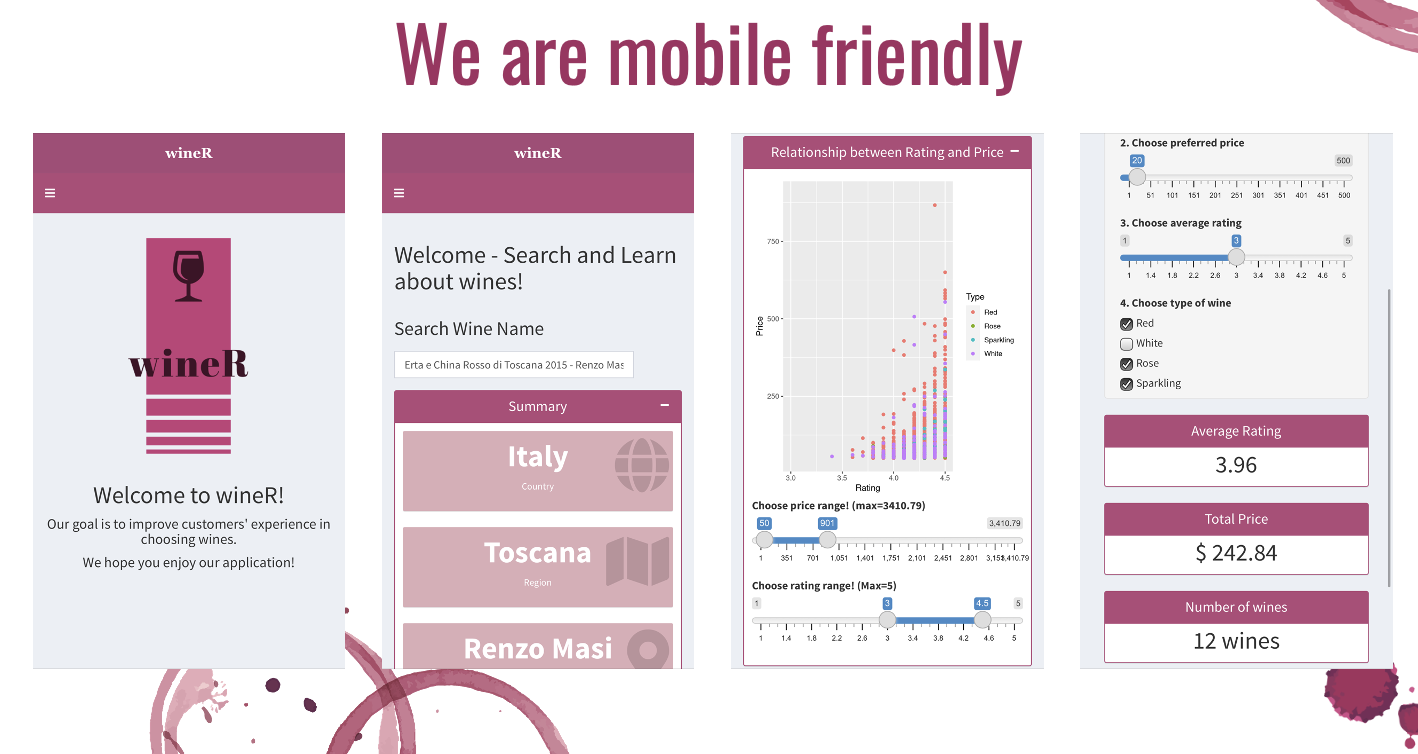
This application is fully reactive - gives customers best experience of using this application even in mobile environment!
[App in the mobile]
