Introduction
In this project, our group performed survival analysis on lung cancer data to describe current survival rate by various different factors and determine significant factors that affect the survival rate over other factors.
-
Tools / Libraries used: R / mice, survival
-
Dataset: North Central Cancer Treatment Group (NCCTG)
-
Analyses Performed: Kaplan-Meier Plot, Cox Proportional Hazards Model, CART(for Imputation)
Analysis
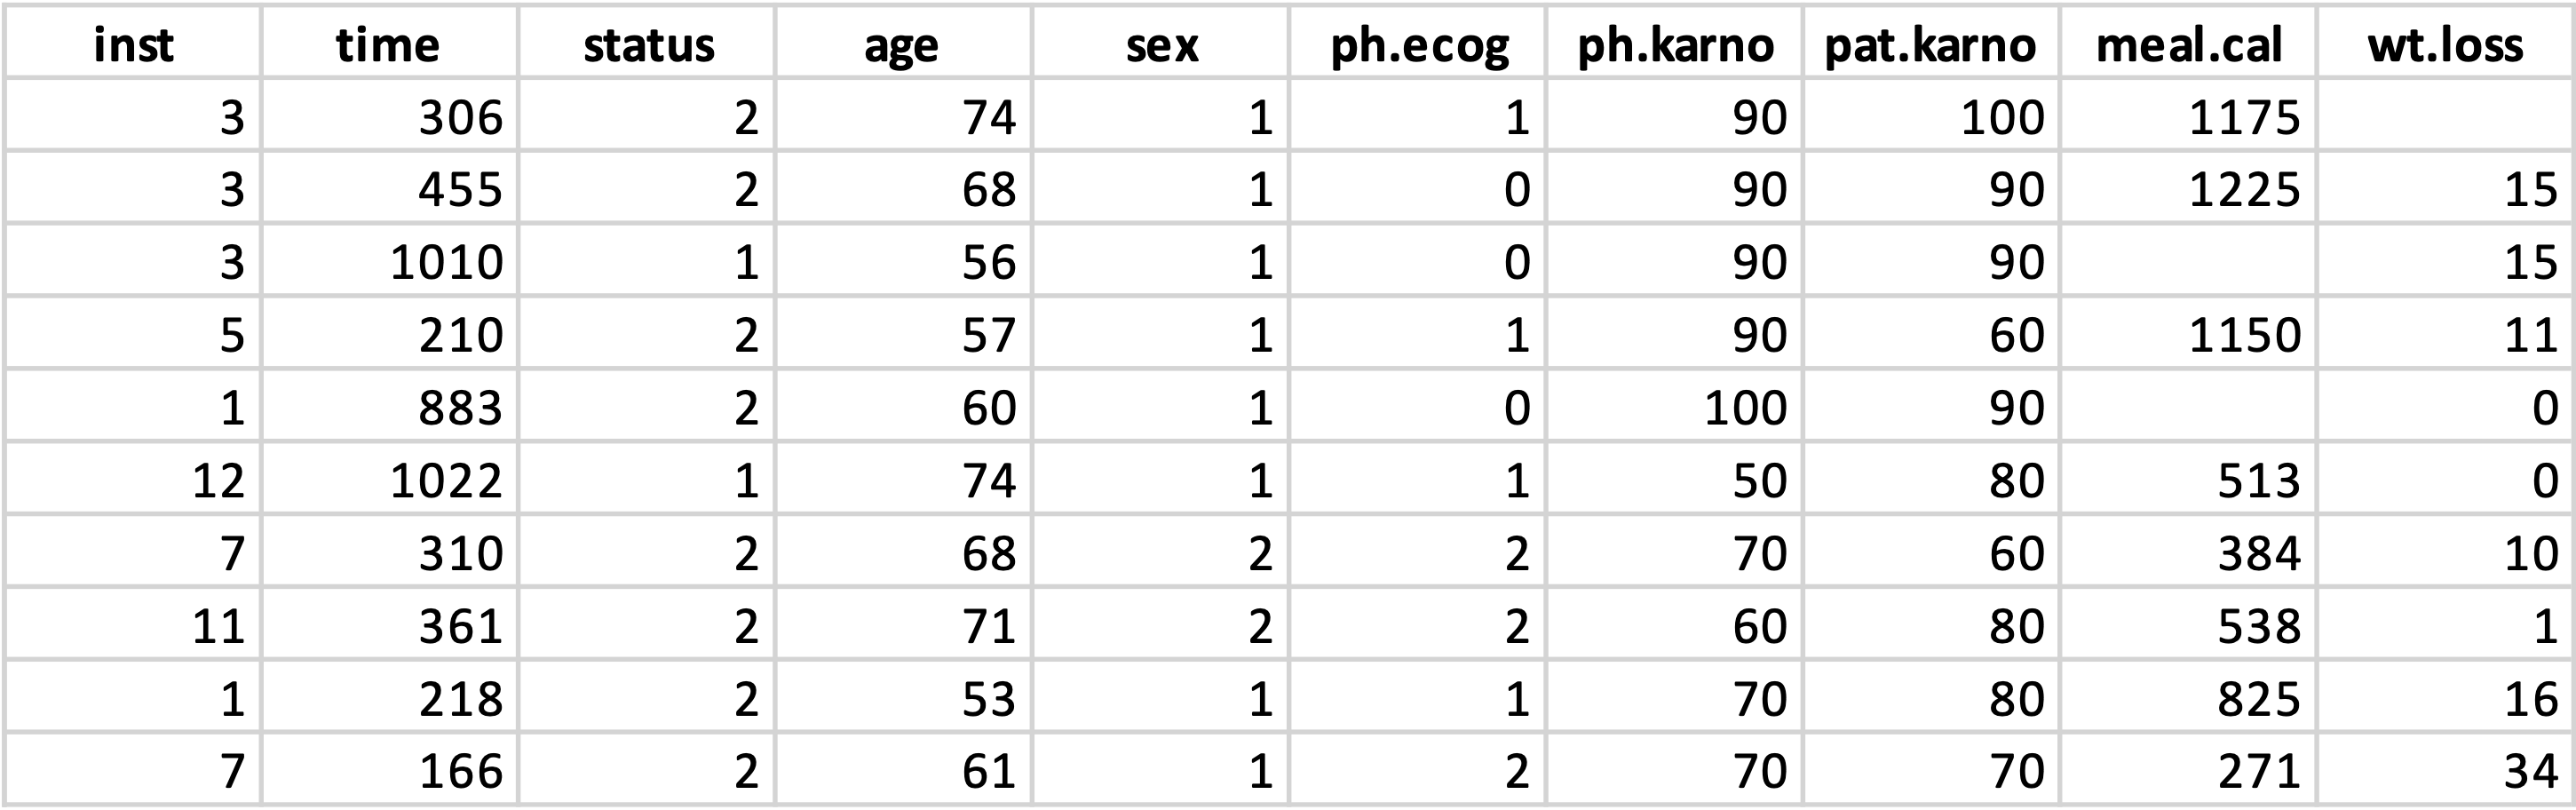
Our dataset consists of 10 columns and 228 rows and is patient-level records. Each row stands for unique patient, while each column means the following:
- inst: institution code
- time: survival time in days
- status: cencoring status 1=censored, 2=even happened
- age: age in years
- sex: male=1, female=2
- ph.ecog: ECOG performance score as rated by physician(asymptomatic=0 - bedbound=4).
- ph.karno: karnofsky performance score (bad=0 - good=100) rated by physician
- pat.karno: karnofsky performance score as rated by patient
- meal.cal: calories consumed at meals
- wt.loss: weight loss in last six months
[Dataset]
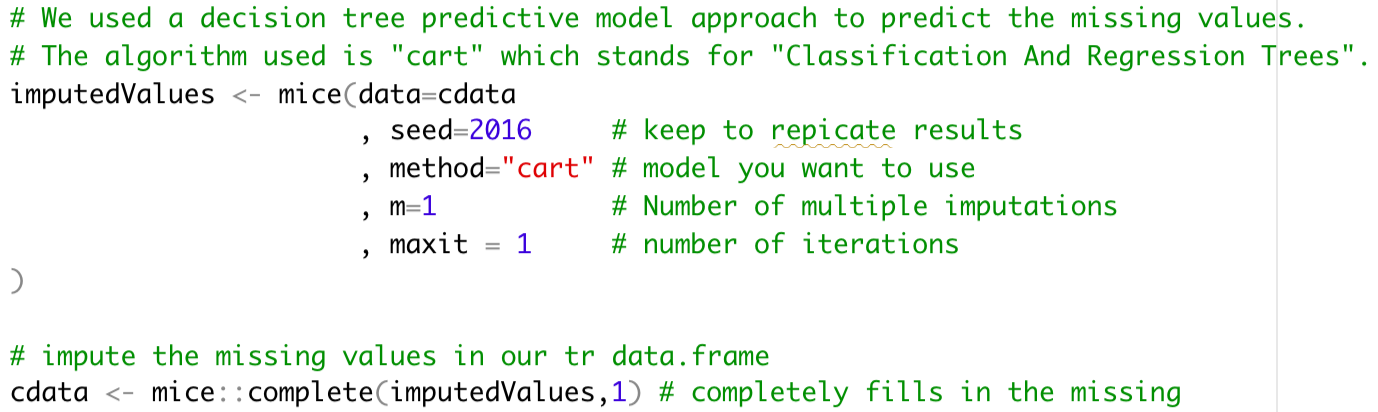
The dataset contained 67 NAs. Since deleting them would lead us to loss much information, we decided to impute these missing values by using a decision tree predictive model approach to predict the missing value. To do so, we used CART (Classification And Regression Trees).
[R codes for data imputation (CART)]
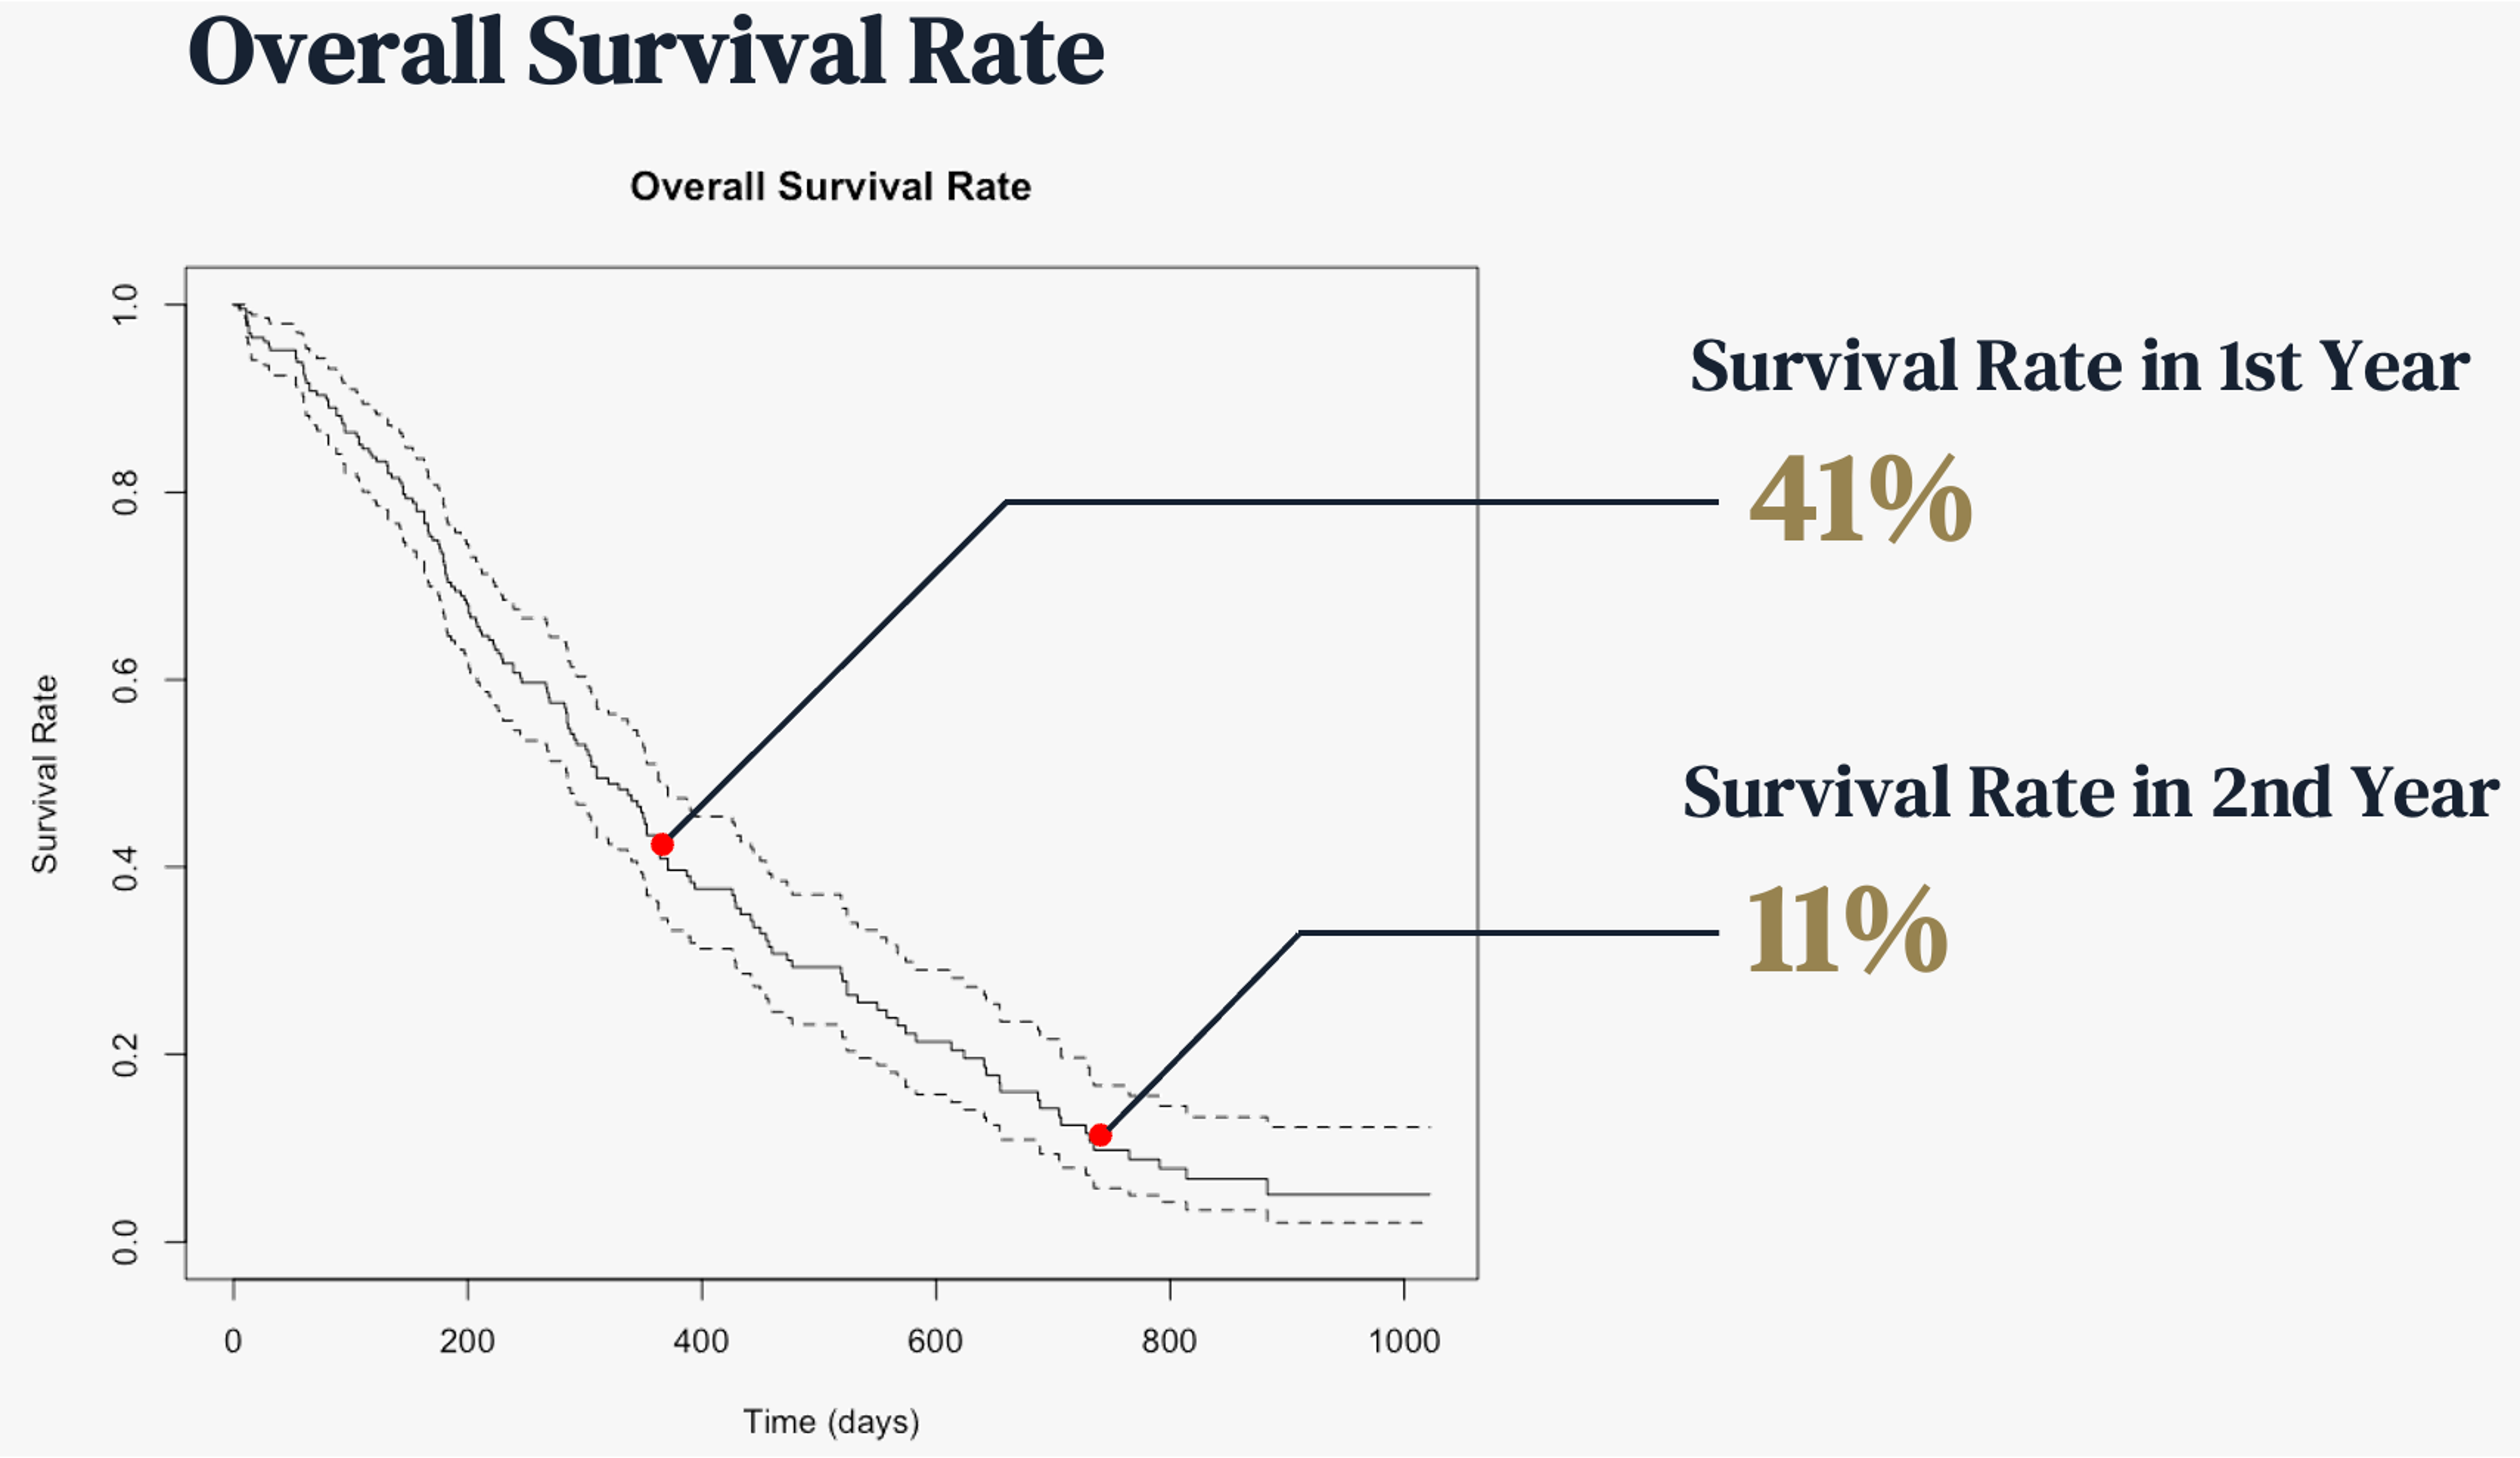
First, the graph below is showing the overall survival rate. 41% patients survived by the first year and 11% patients survived by the second year. Despite the small size of records, this graph depicts severity of lung cancel well.
[Overall survival rate]

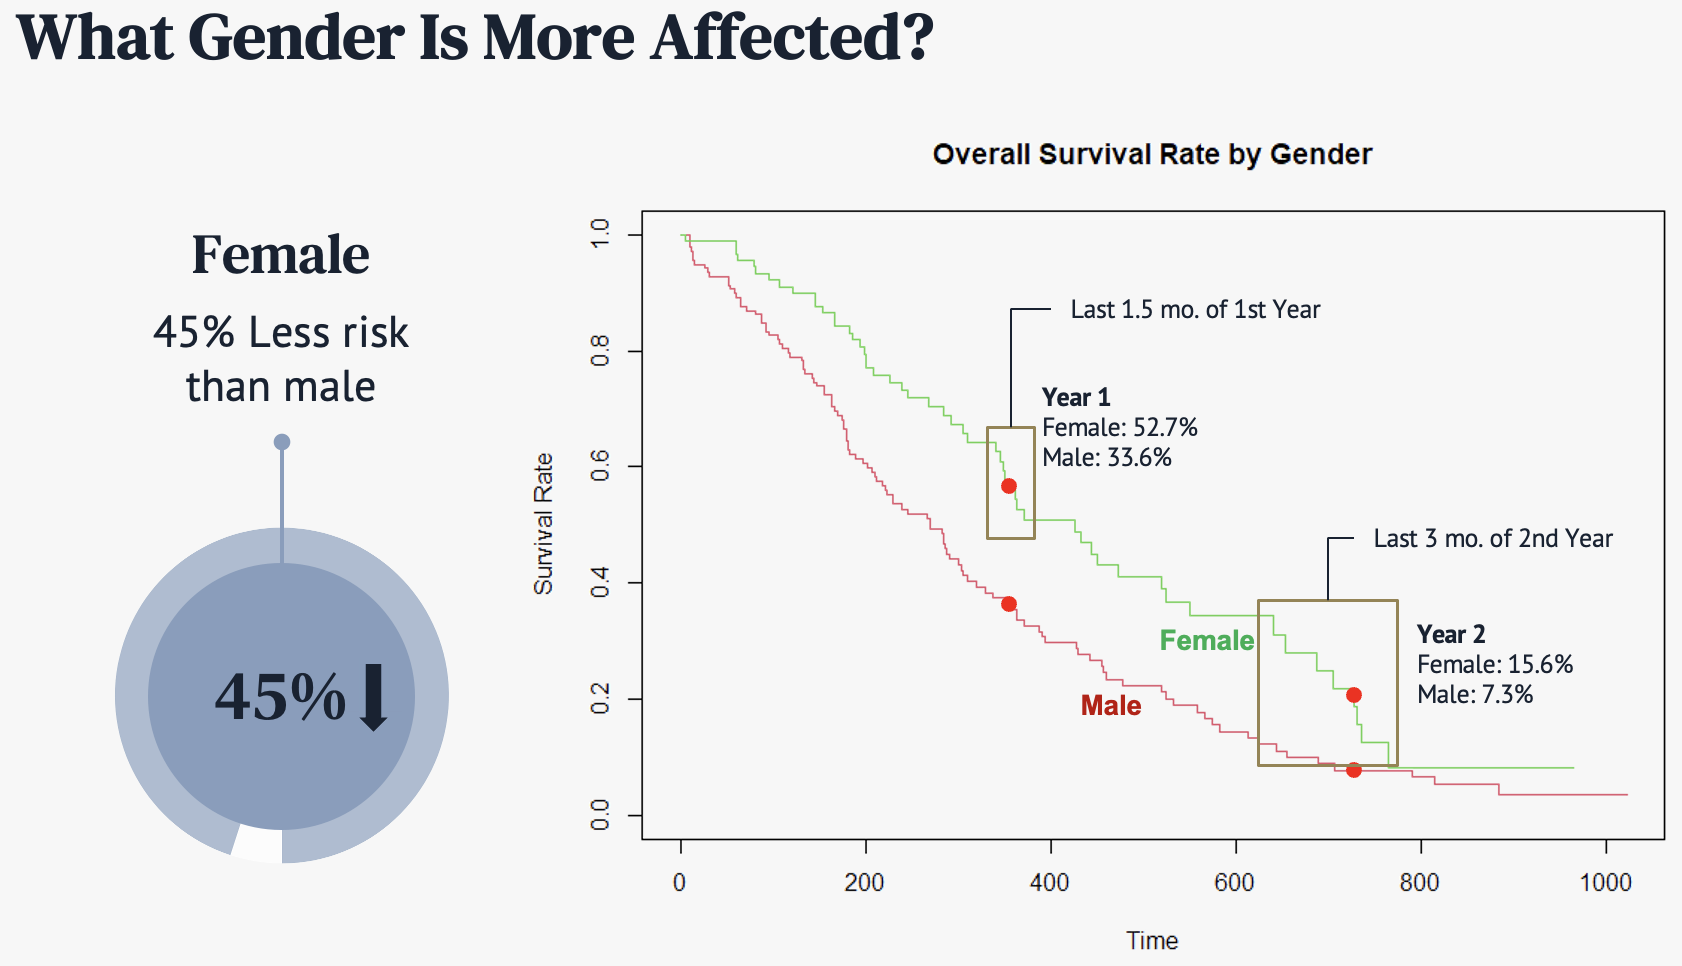
Then we analyzed the survival rate in more detail by different factors. In this data, female tends to have 45% less risk than male on average, based on cox model. As we can see from the graph on the right hand side, the survival trend of the female is higher most of the time.
[Survival rate by sex]
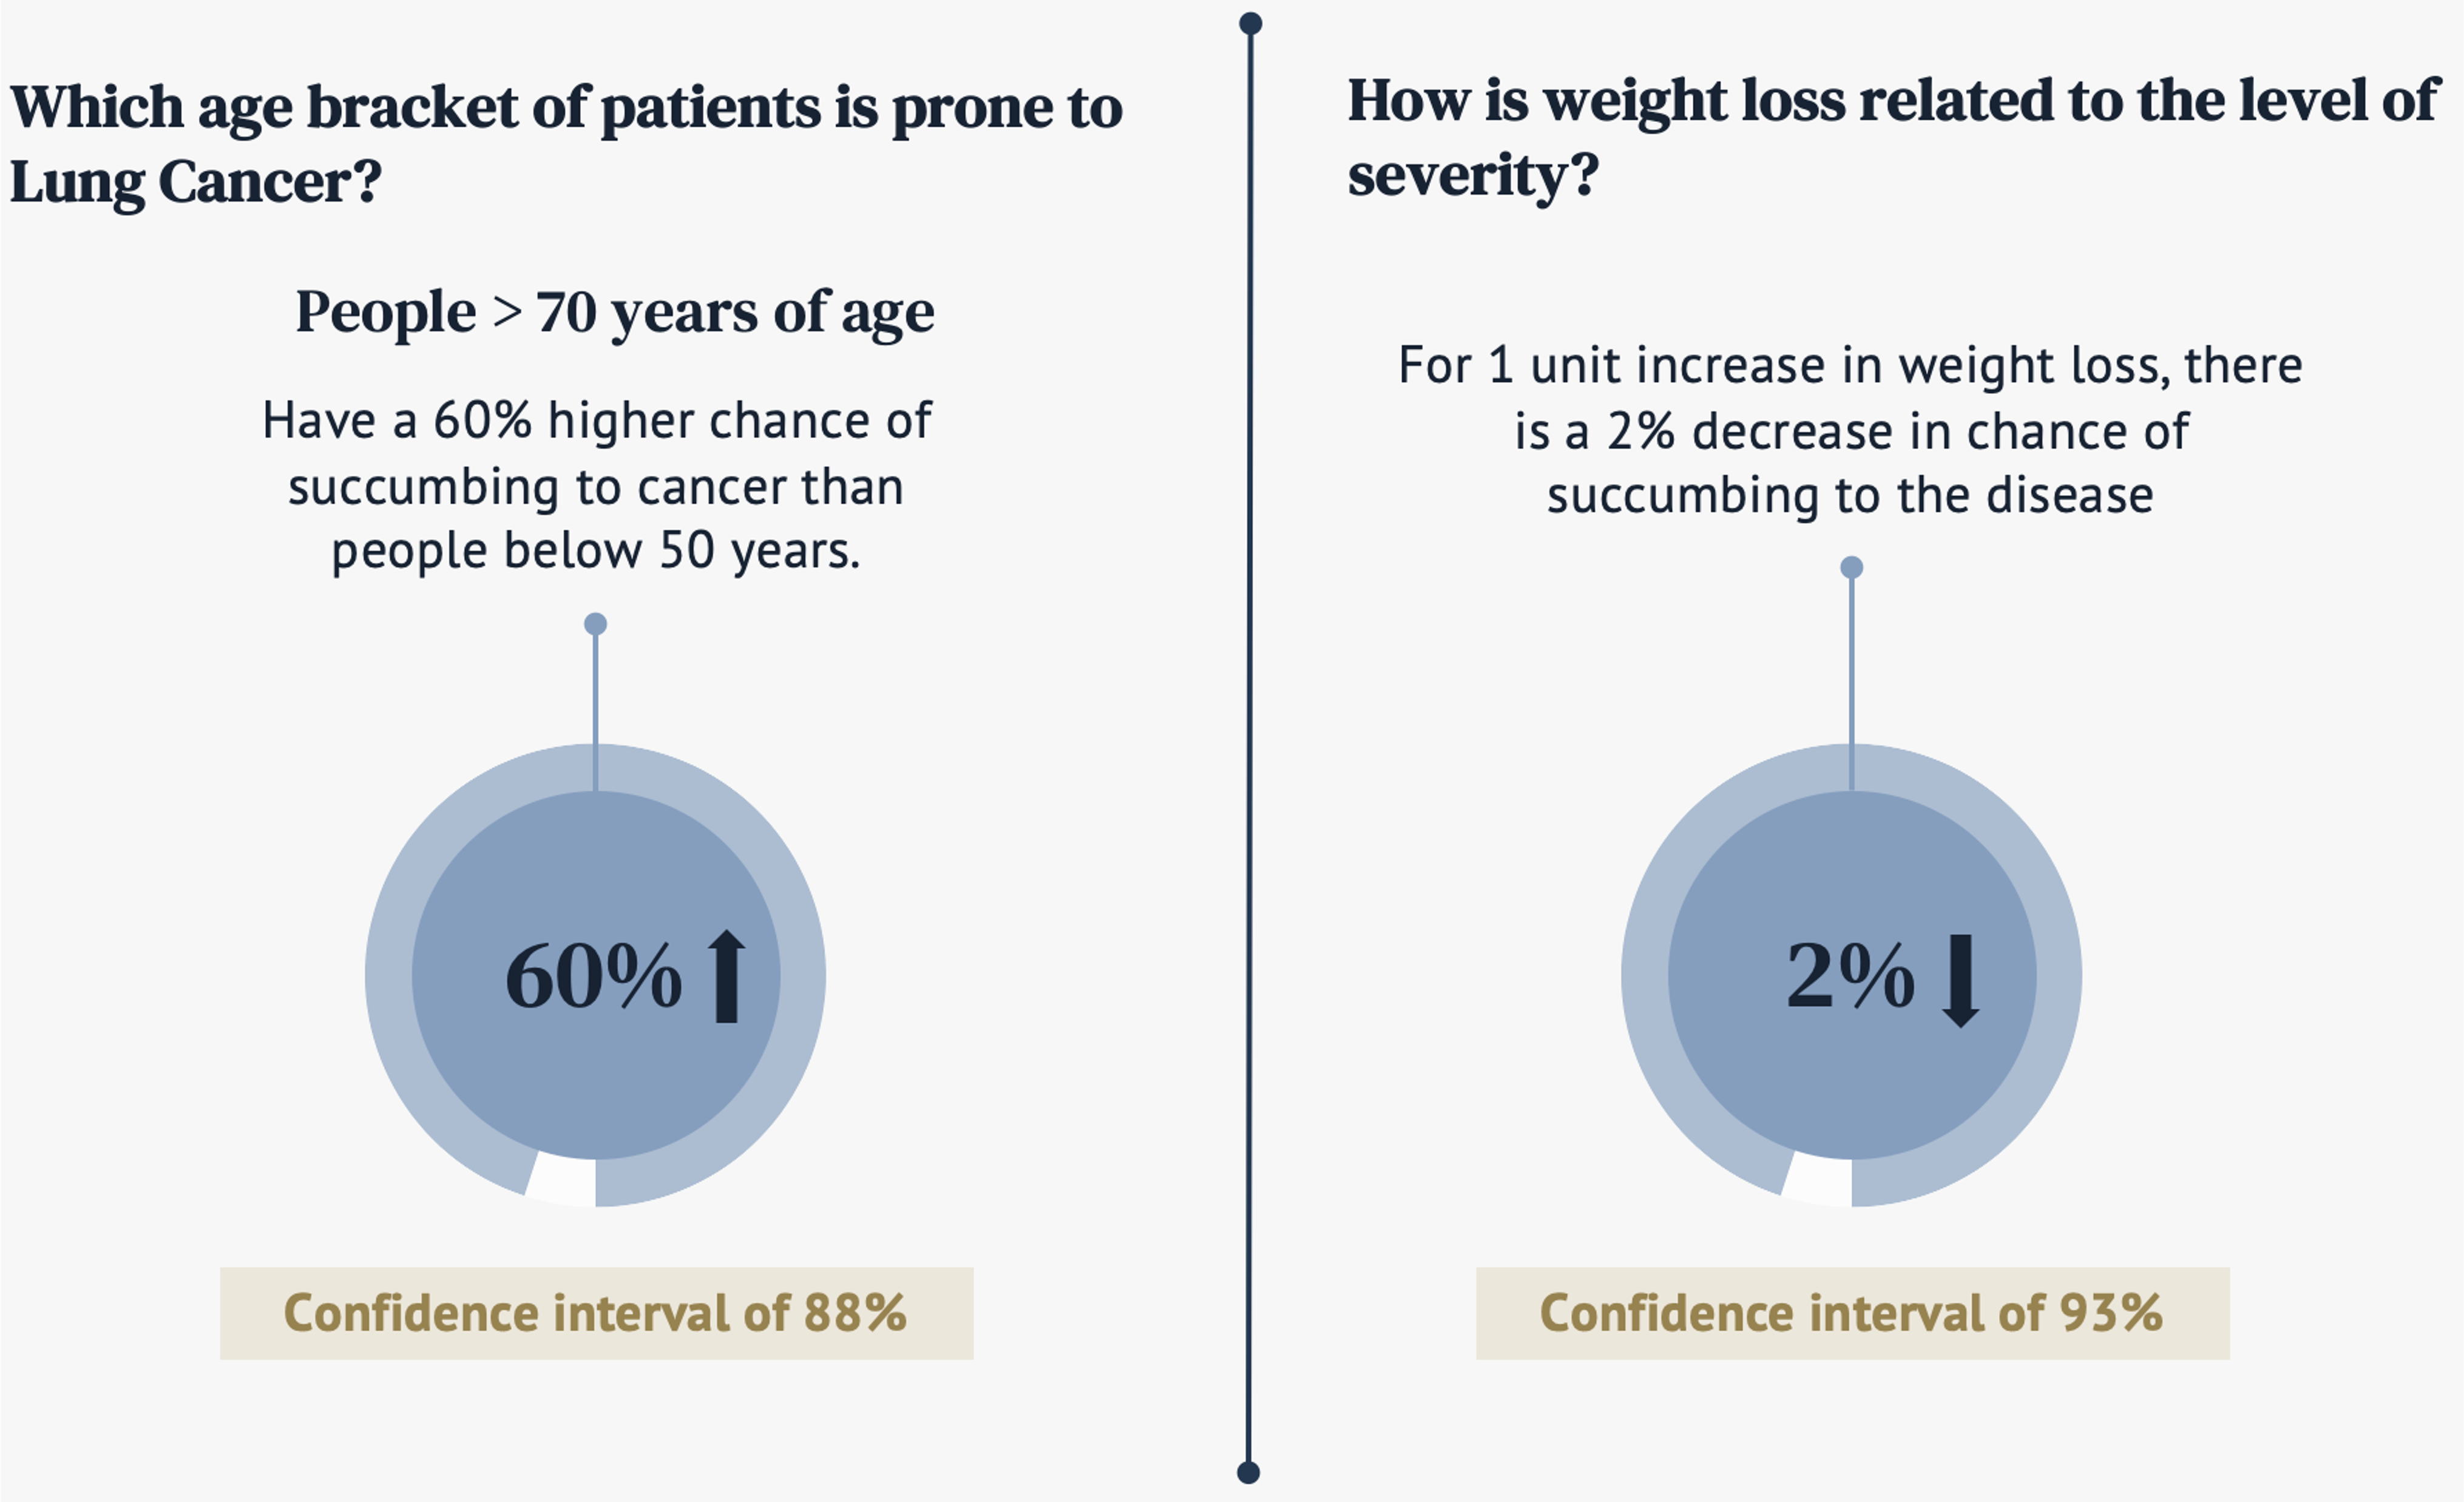
By age, patients over 70 years old have 60% higher chance of succumbing to cancer than people below 50 years. By weight, for 1 unit increase in the weight loss, there is a 2% decrease in chance of succumbing to the dieases.
[SUrvival rate by age and weight]
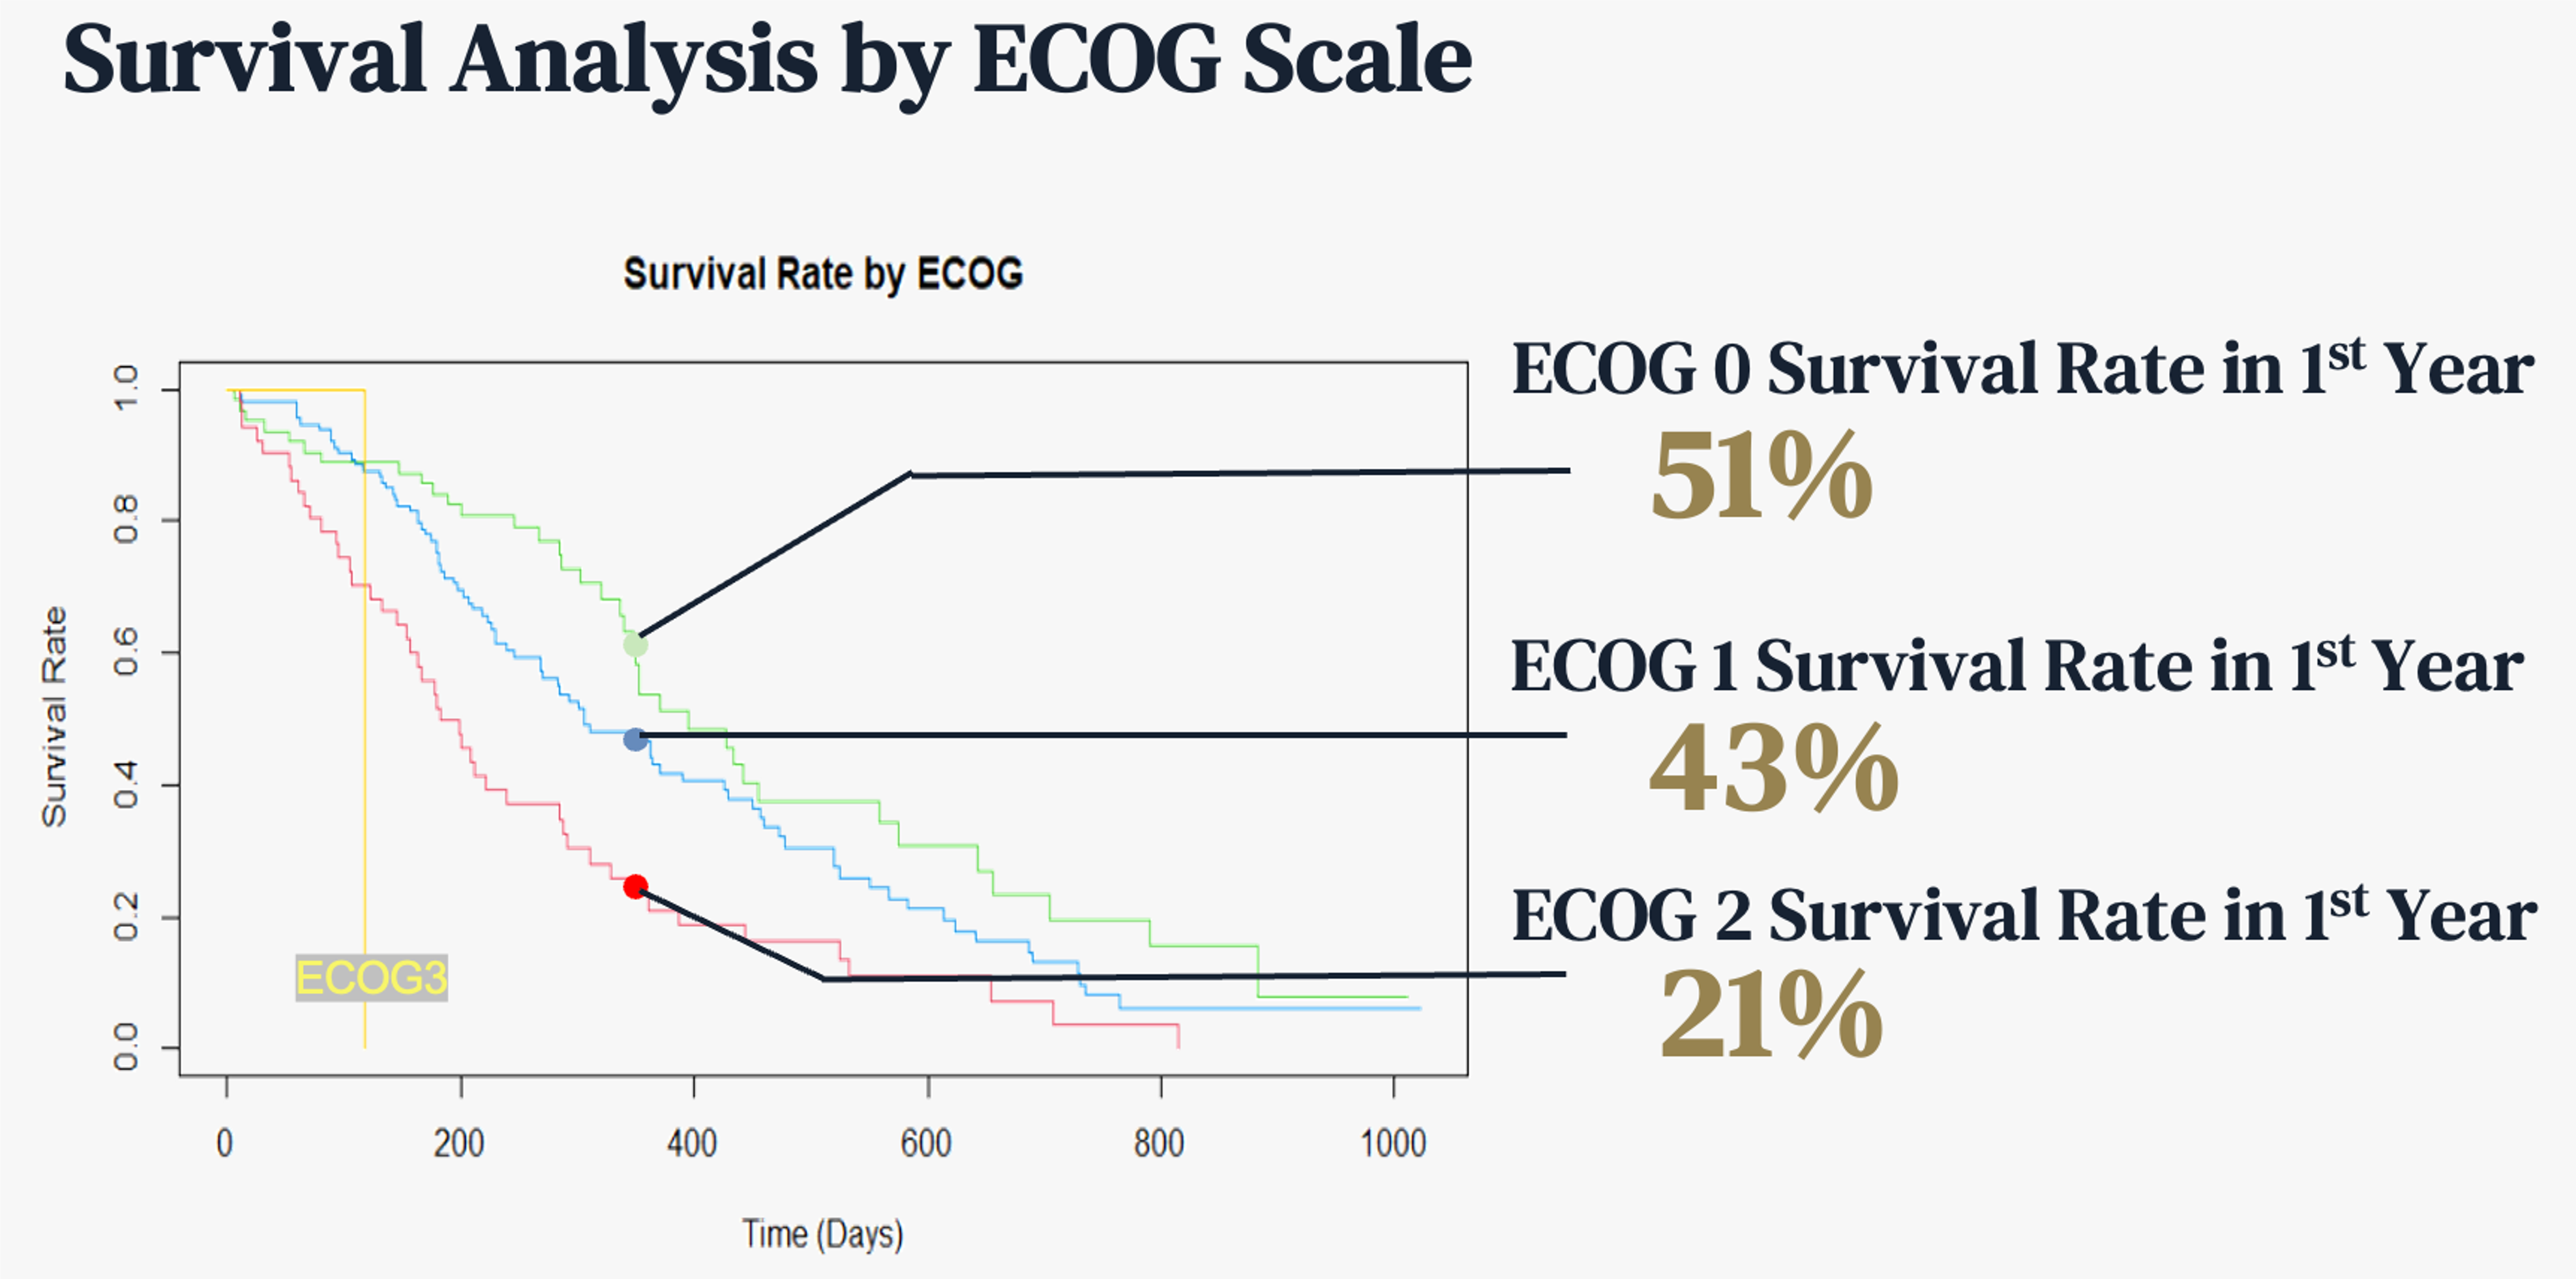
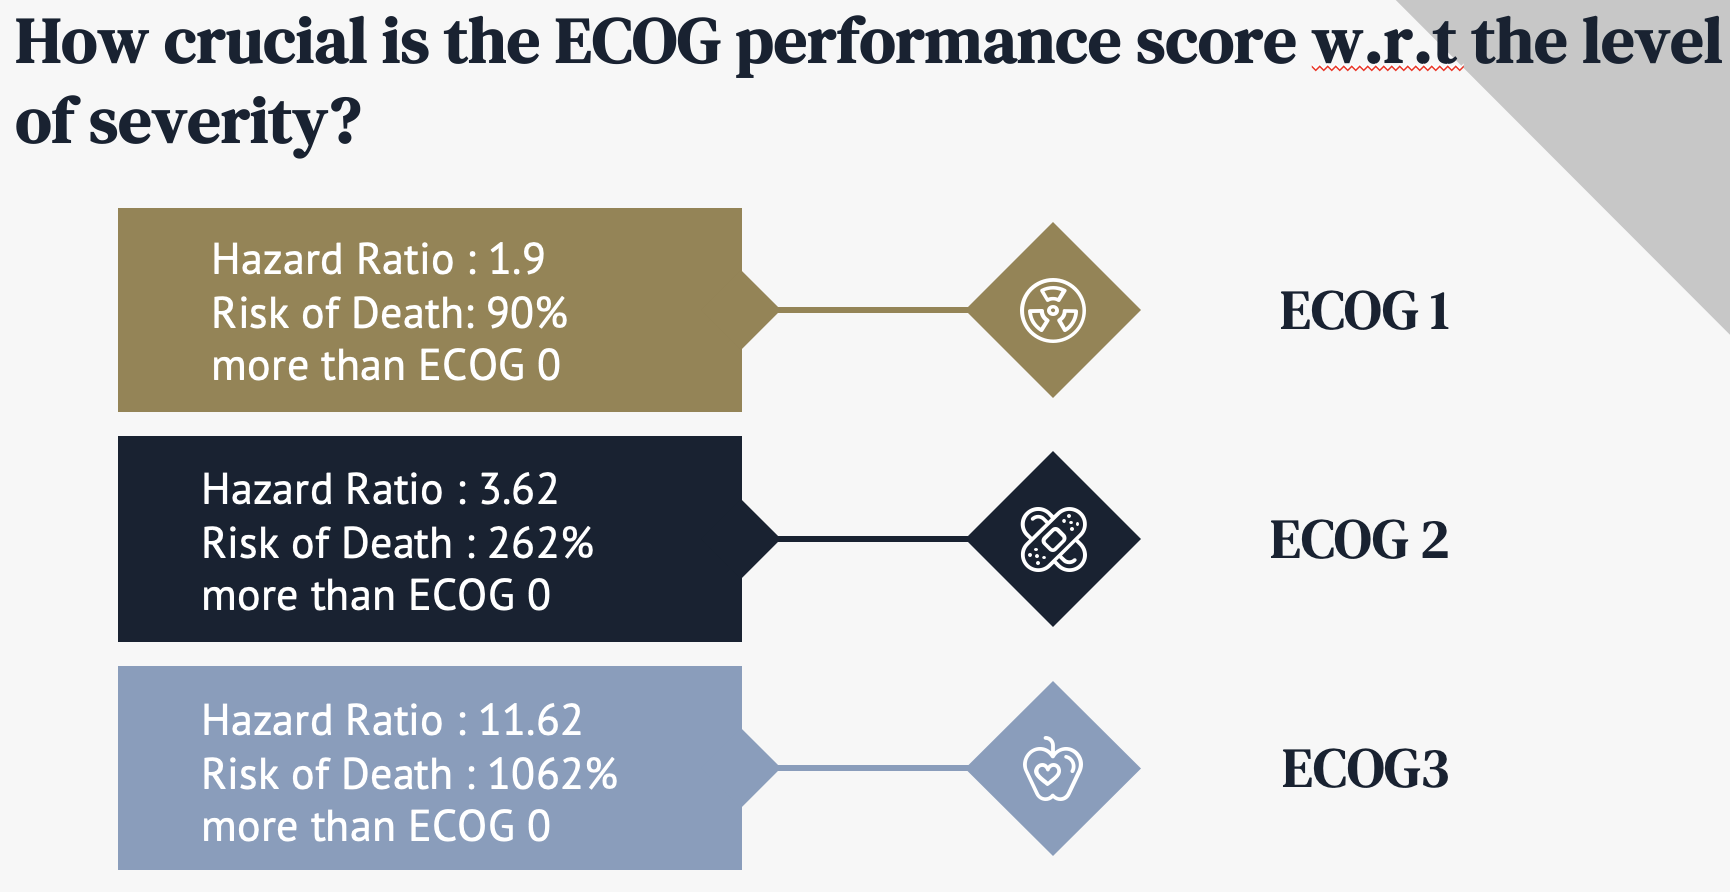
We noticed clear trends of survival rate by types of ECOG as well. In the first year, ECOG=0 has higher survival rate than ECOG1 and ECOG2. Based on the cox model, patients who are in ECOG 1, ECOG 2, and ECOG 3 type have 90%, 262%, and 1,062% more risks of death than patients who are in ECOG 0, by more than 95% confidence level.
[Survival rate by ECOG]
[Survival rate by ECOG - cox model]
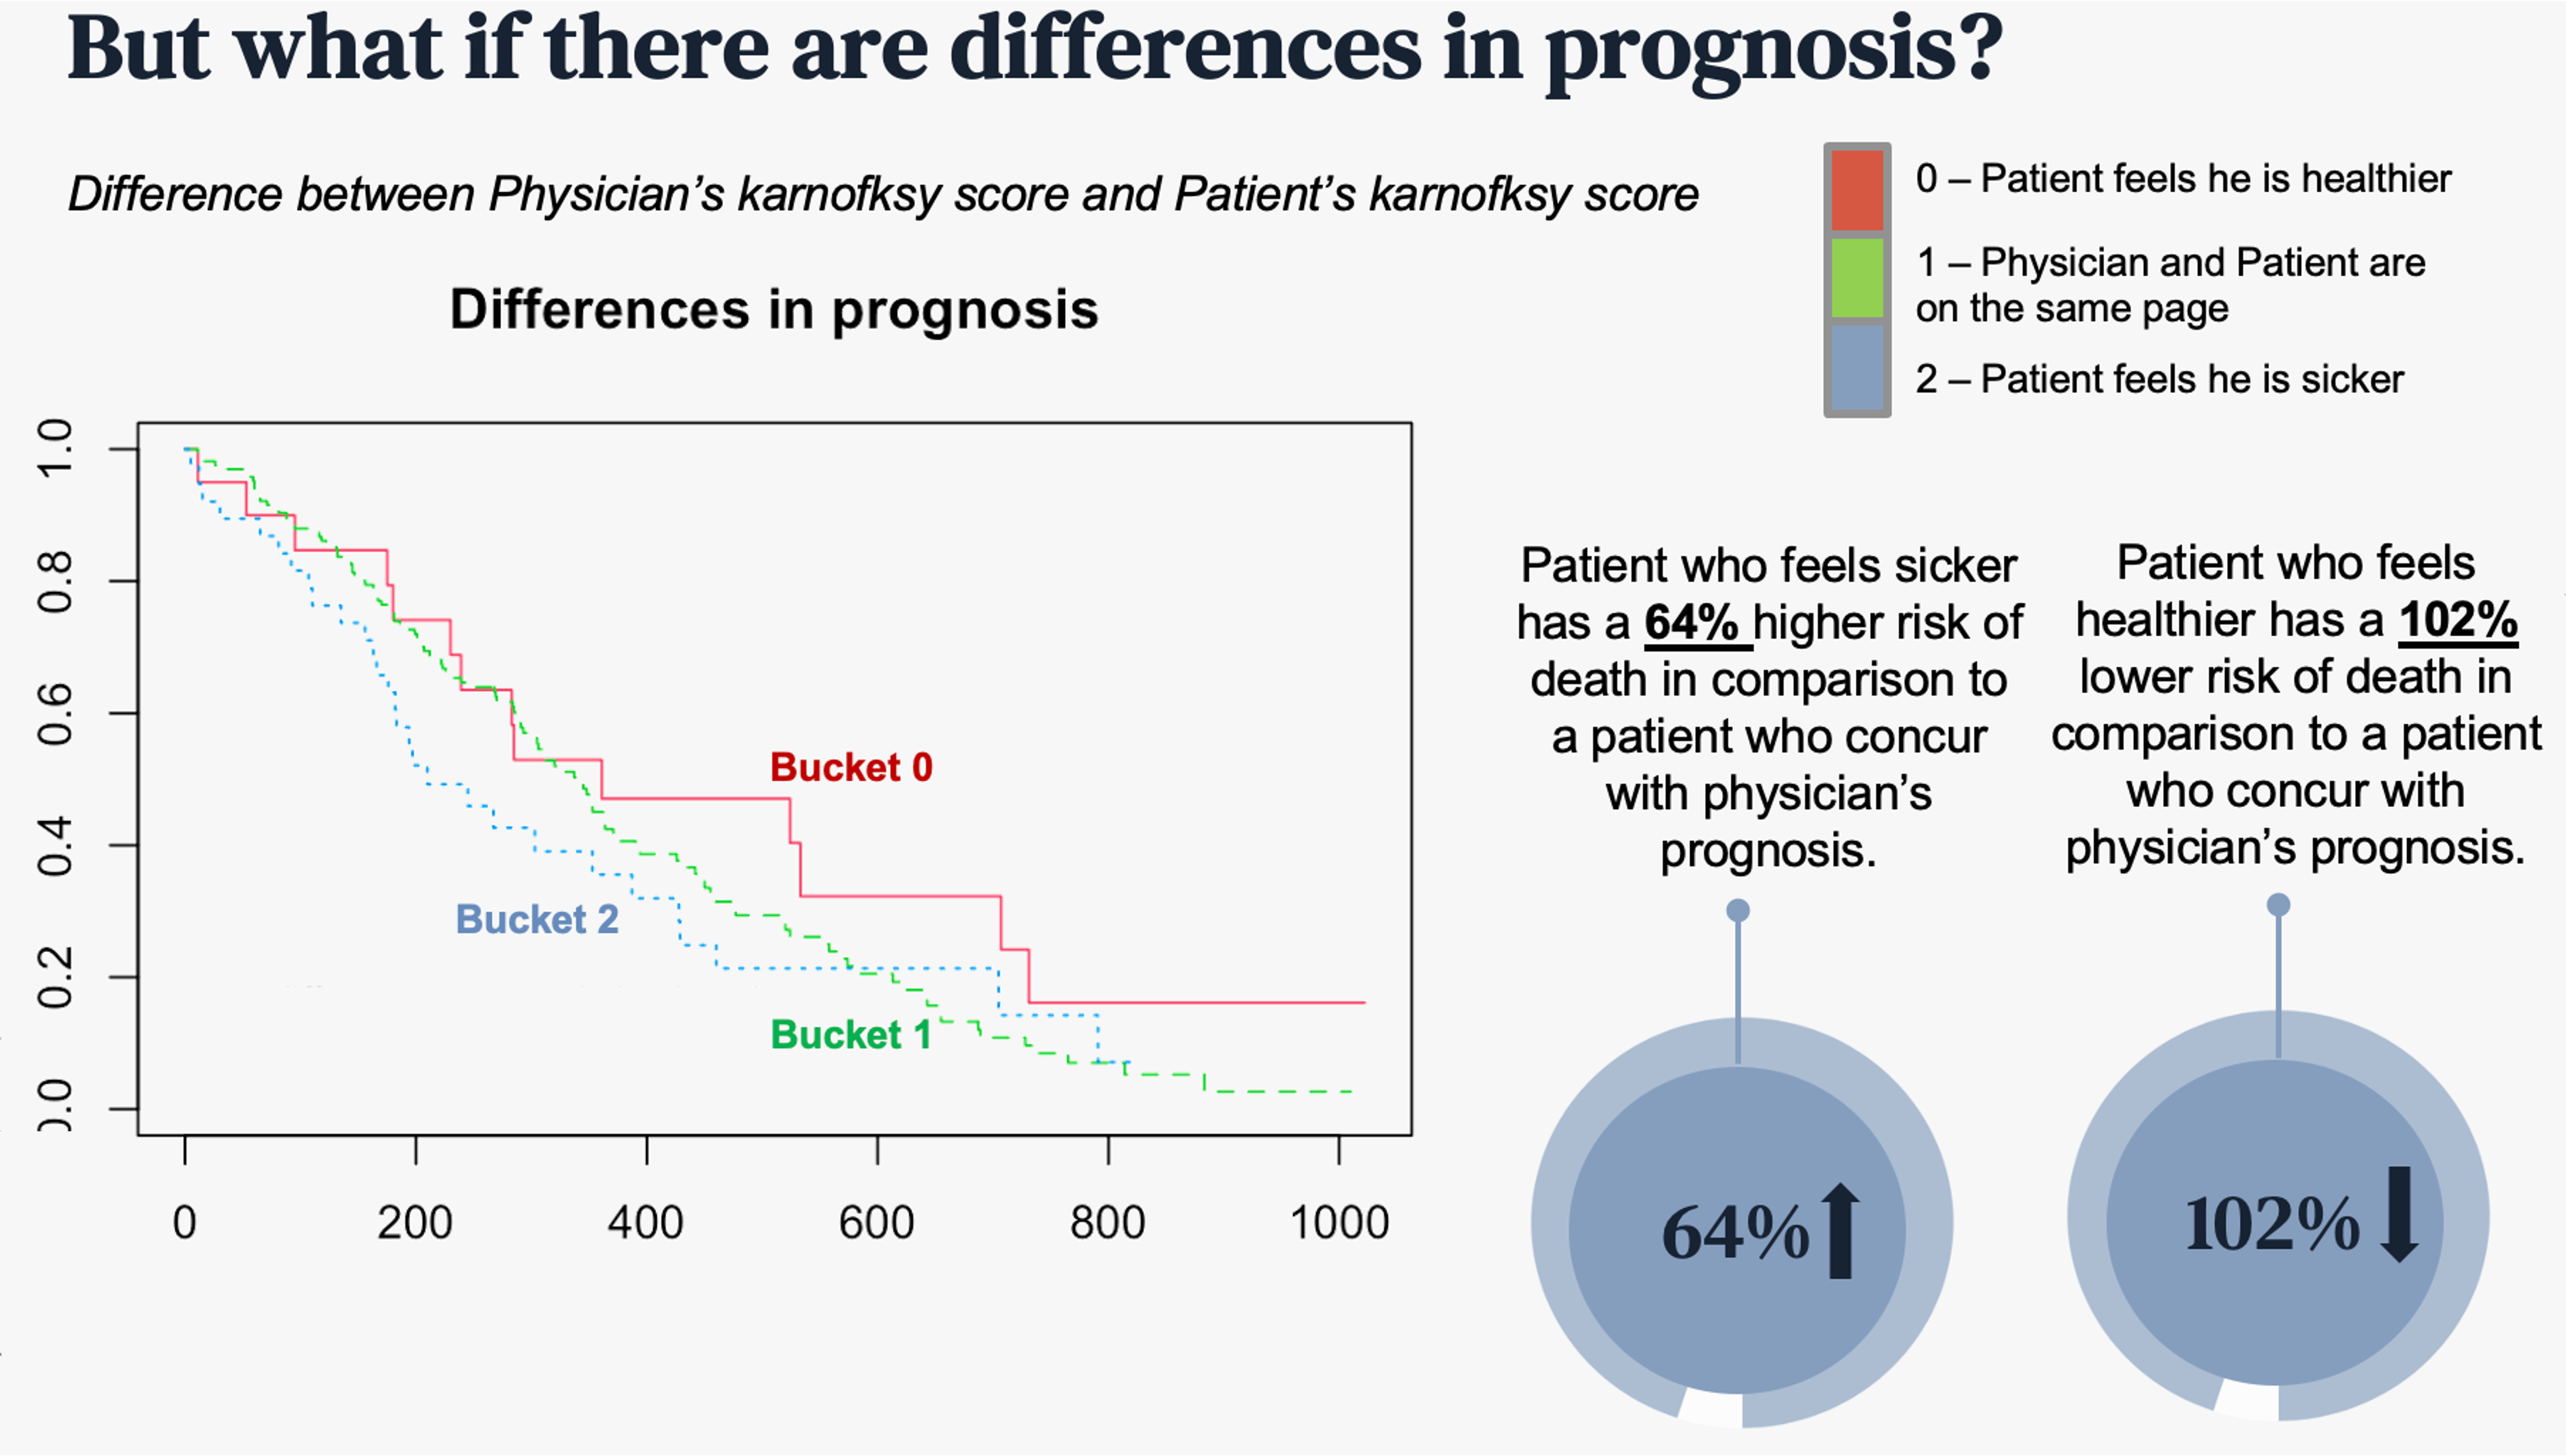
The survival rate trends by karnofksy scores by both patients and physicians were not statistically significant. However, we found out that the survival rate by difference between these two was significant. After taking the differene of these two factors, we categorized them into three buckets; 0 being patient feels she/he is healthier, 1 being physician and patient are on the same page, and 2 being patient feels she/he is sicker.
Based on the cox model, patients who feel sicker has 64% higher risk of death where as patients who feel healthier has a 102% lower risk of death compared to the others.
[Survival rate by karno. score]
Conclusion
Our analysis would give insights to medical professionals for better treatment and decision making. In addition, based on our analysis, we would be have to make a few recommendation to medical professionals and stakeholders:
- Make patients believe that they are healthier than they feel or think
- Partner with health fitness companies to better track calorie intake and weight loss
- Usage of additional metrics sush as quality of life or body mass index.
The survival analysis is often undervalued especially nowadays due to high rise in AI, machine learning and deep learning. However, the survival analysis such as KM plots and cox proportional hazard model can be a very strong tool to describe and evaluate cencored information by many different factors. It can by not only used in medical fields but in many different situations such as in customer analysis (analyzing churn rate).

Text Classification for Proper Categorization of Postings
Intelligently Ordering Machine Translation Seed Data to Improve Local Language Translation