
Summary
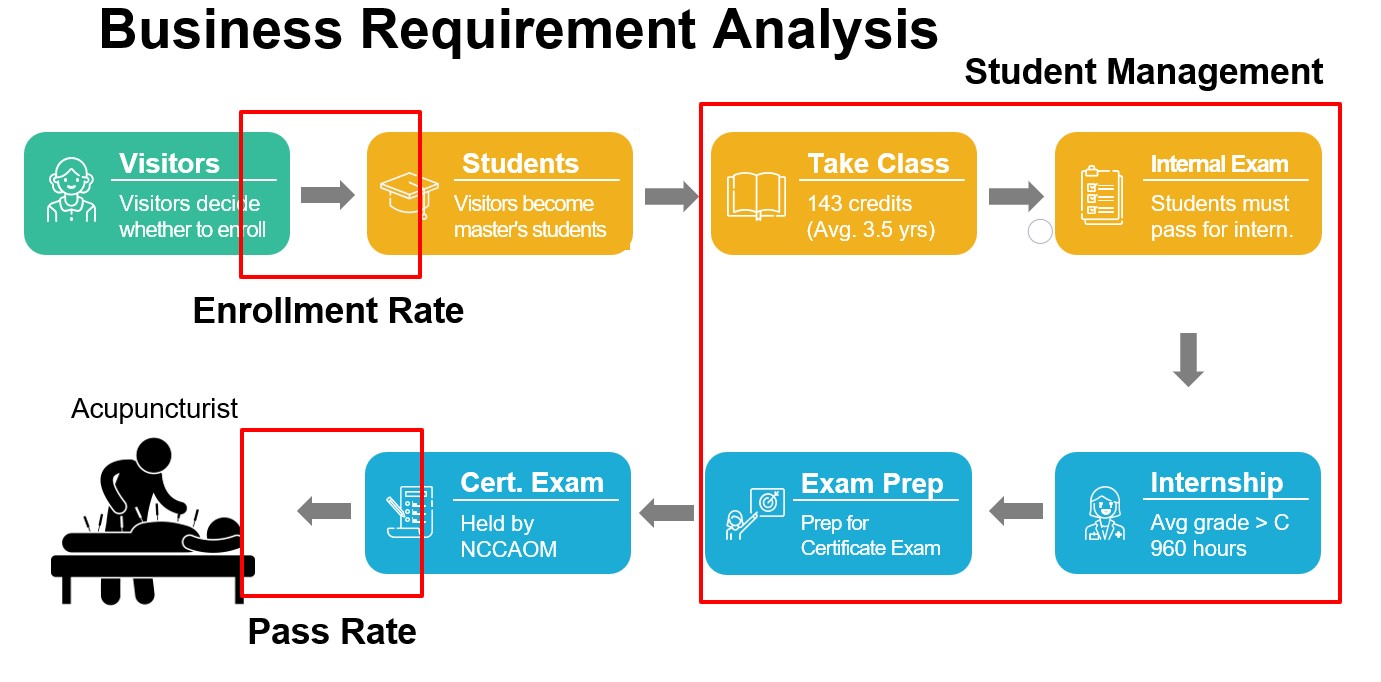
California University Silicon Valley is an accredited private university that offers master program for students who want to become licensed acupuncturists. The students must complete 143 credit, or average of 3.5 years, and 960 hours of internship to be eligible for the certificate examination. Our client wants to manage key metrics which are certificate exam pass rate, enrollment rate, student managment effectively. However, its lack of IT capacity leads to high time consumption and low accuracy in decisions they make. Our goal is to build effective database management system and SQL queries that accomplish its business objectives.
-
Tools / Libraries used: SQL
-
Dataset: Acquired from client / student(name, grade, etc.) and course information
-
Analyses Performed: Business Requirement Analysis, ERD, Relational Schema, Data Cleaning, Database Normalization
Key Takeaways
- Performing business flow analysis allowed us kinds of data to collect from our client. The data that we requested are: visitor data(time visited, name), students data, course data, and exam pass data.
- Then we built ERD and relational schemas (see below). Next, we performed data cleansing. We removed data redundancy, change data format for consistency, and normalized from 0NF to 3NF.
- Then we uploaded the table into SQL and performed analysis. Please see 5. Business Insights and Recommendations below for detail.
- The current pass rate is 74% and enrollment rate is 7%.
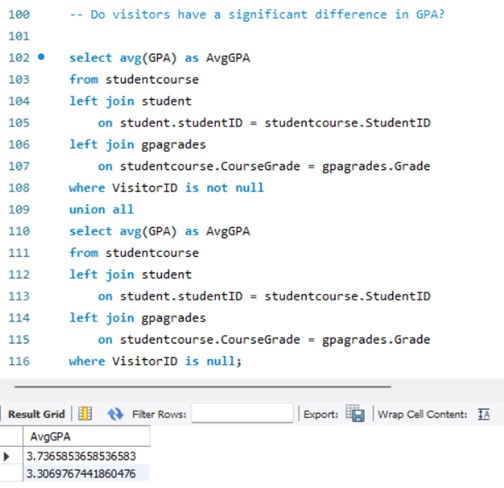
- Students who visited have an average GPA of 3.74, whereas students who did not have an average of 3.31.
- Categories of courses have widely different average grades.
- 13% of the students are at risk of not completing the program.
- With our analysis, we expected the company to have positive short-term and long-term effective. In a short term, the company would be able to reduce the cost in human expenditure by 45% and increase efficiency by 88%. Moreover, in a long run, the company would be able to enhance the education quality, ultimately leading to positive effectives in its KPIs.
Details of the Project
1. Background
California University – Silicon Valley (CUSV) is a school that provides a master’s program in Acupuncture and Oriental Medicine (AOM). The aim of the school is to train students to become AOM professionals, with the ability to practice as independent health care providers in a variety of setting including medicine theory, acupuncture, herbology & herbal formulas, Western medicine & science, Tui Na (traditional Chinese massage therapy), etc.
To be a Licensed Acupuncturist, one needs to pass a certification exam in the state of California. The average length for the program is 3.5 years including 143 credit hours course and 960 hours clinic internship. Once students finish their minimum credit hours and pass their comprehensive exam, they will be able to work an internship in the clinic which is also a requirement for a certificate.
Also, as a private school, CUSV must report its enrolment and pass statistics to the US government. Currently, they track these metrics manually, which is estimated to cost 3,000 USD per month. An automated database management system would save them this cost and time.
Therefore, we focus on their business scenario from the registration department to certification information including students, courses, instructors, certificates, etc. Try to develop a comprehensive database system that can truly help them examine metrics efficiently.
[University Website]
2. Introduction: project objective
The primary objective for the school is to meet the requirements of the National Certification Commission for Acupuncture and Oriental Medicine (NCCAOM) including the ability to pass the acupuncture and herbal certification exams. Thus, our database system designed is to help trace the certification passing rate as well as other internal exam performance. The database system can at the same time work well as the student management system which helps the school track the in-class as well as the internship performance.
[Business Requirement Analysis]
3. Database Design: ERD and Relational Schema
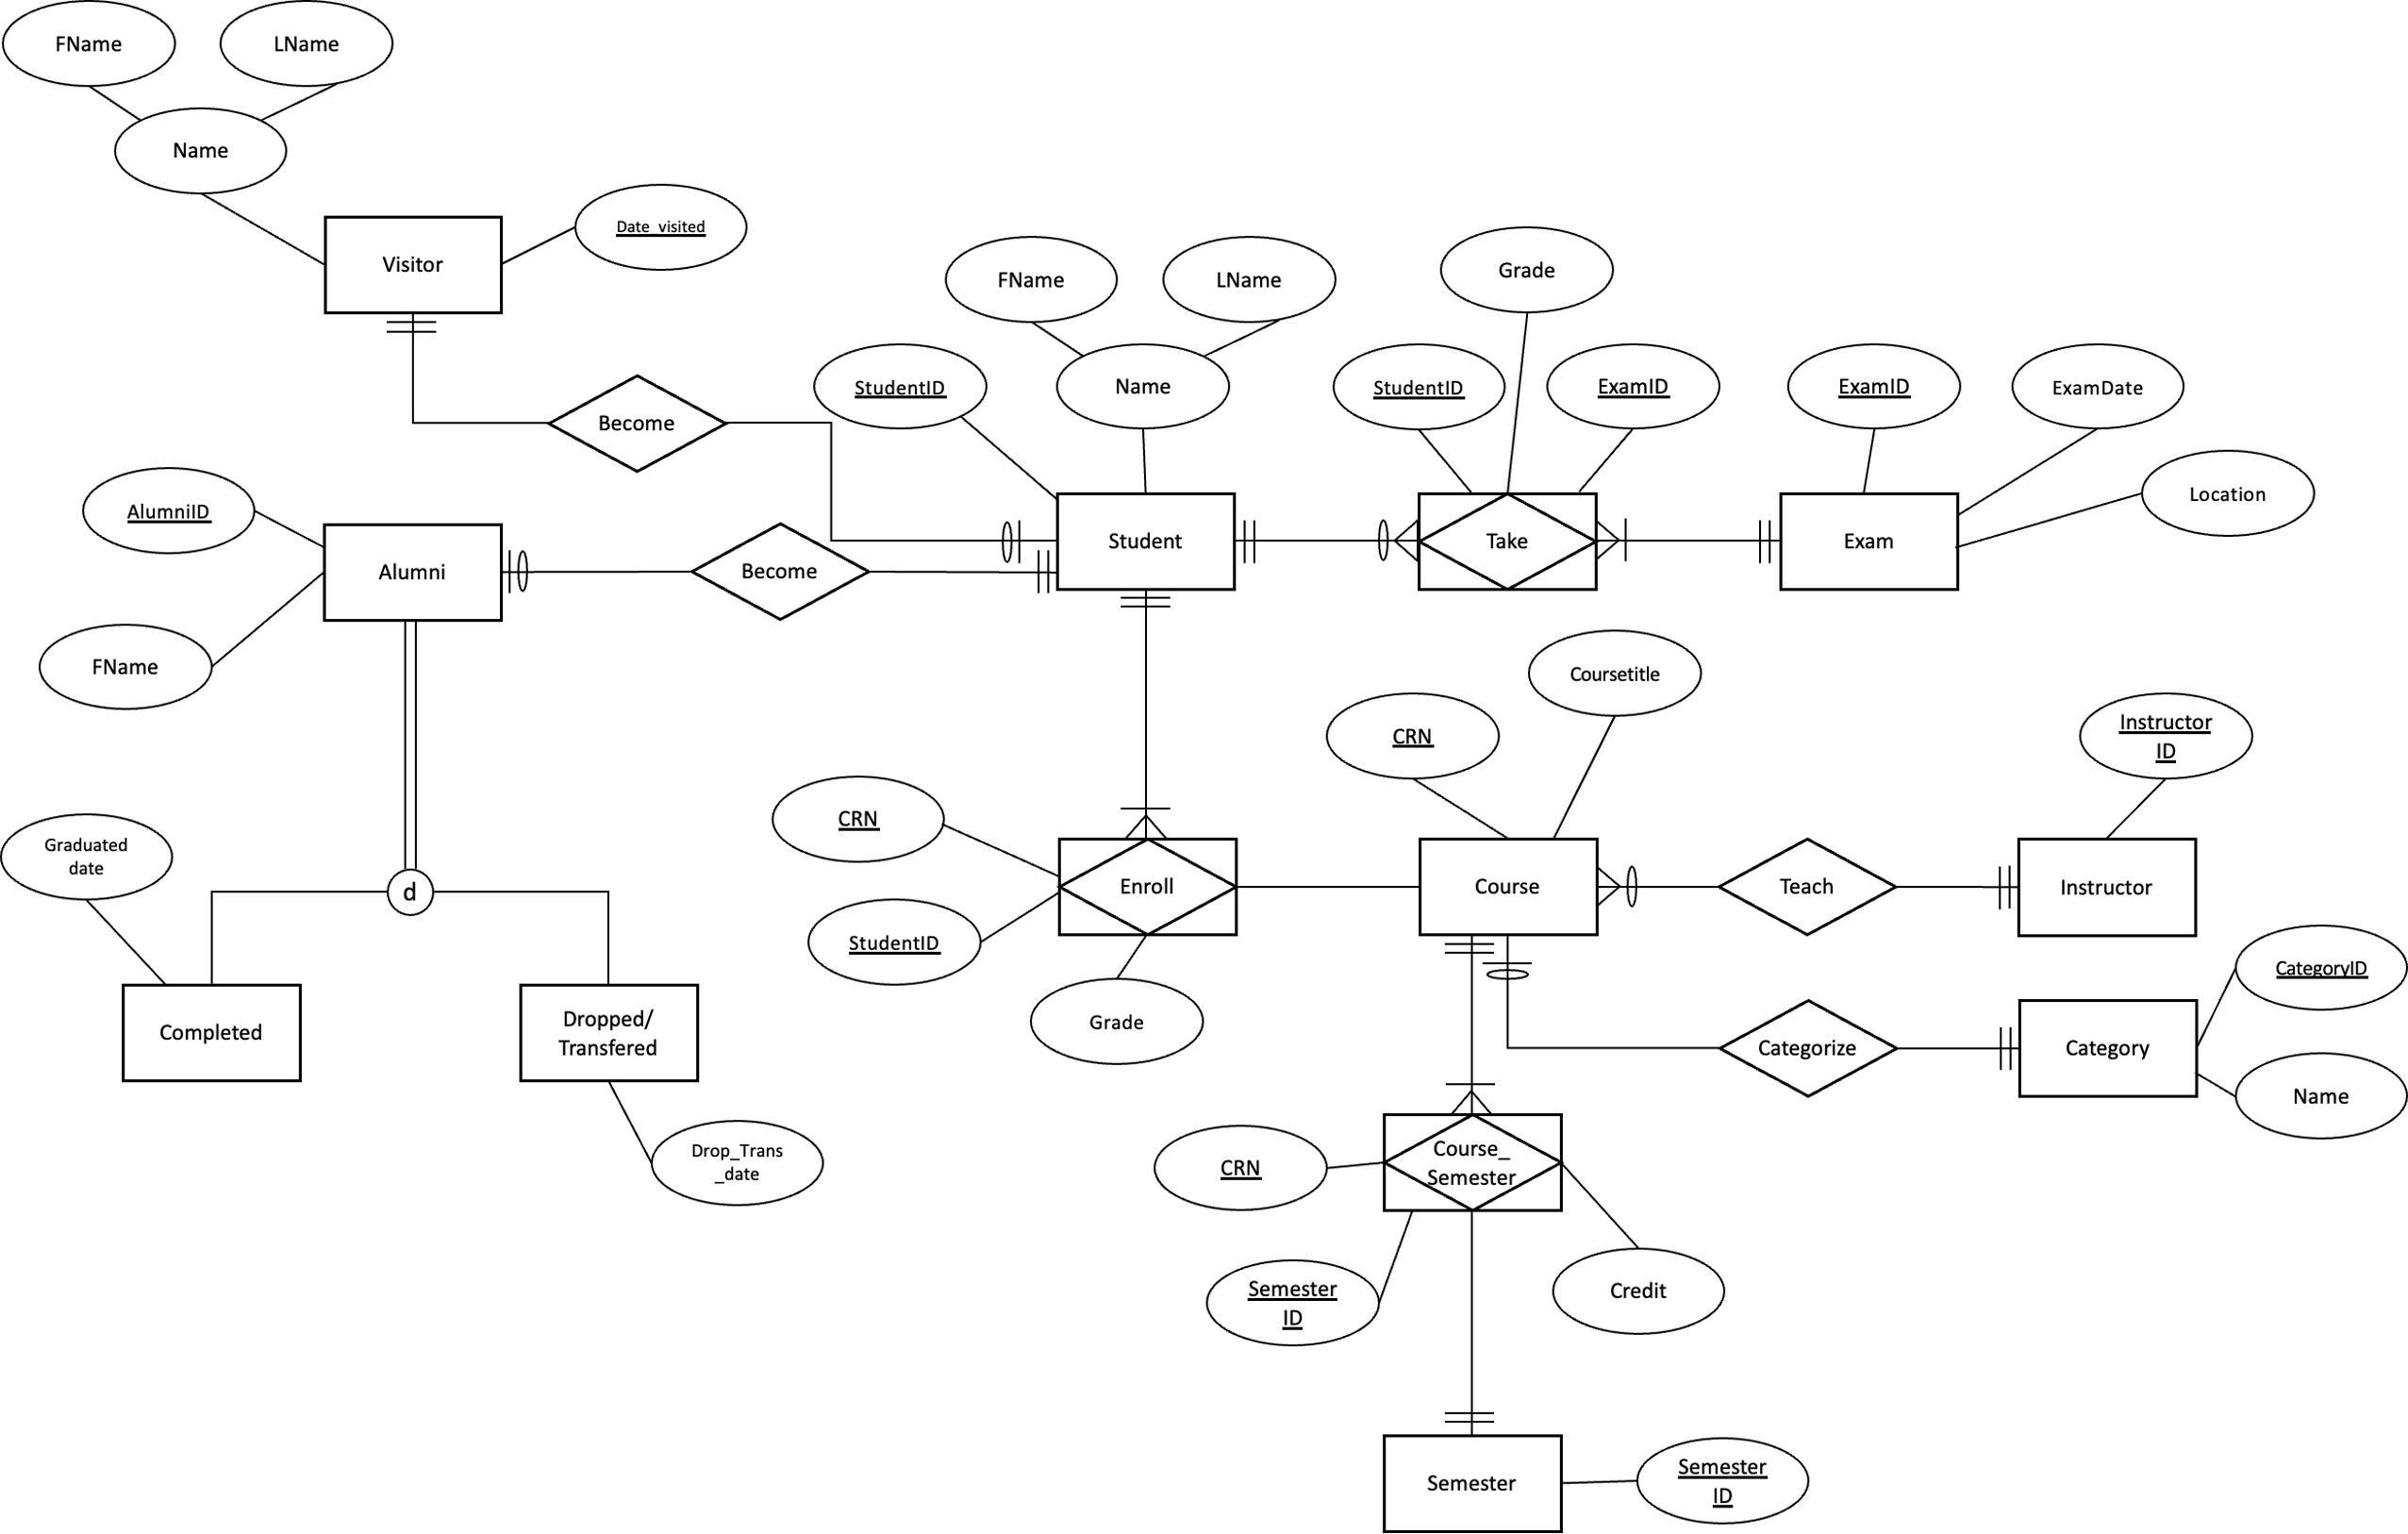
In our database, we have seven entities including Visitor, Student, Exam, Course, Category, Semester, GPAGrade and two associative entities including Take(Student-Exam) and Enroll(Student-Course).
[ER Diagram]
[Relational Schema 1]
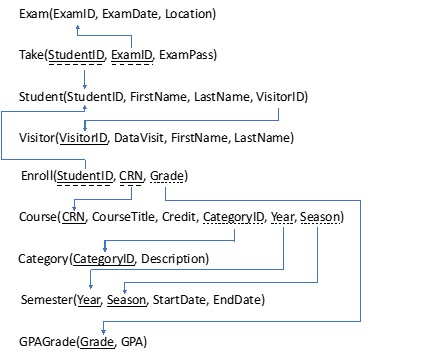
[Relational Schema 2]
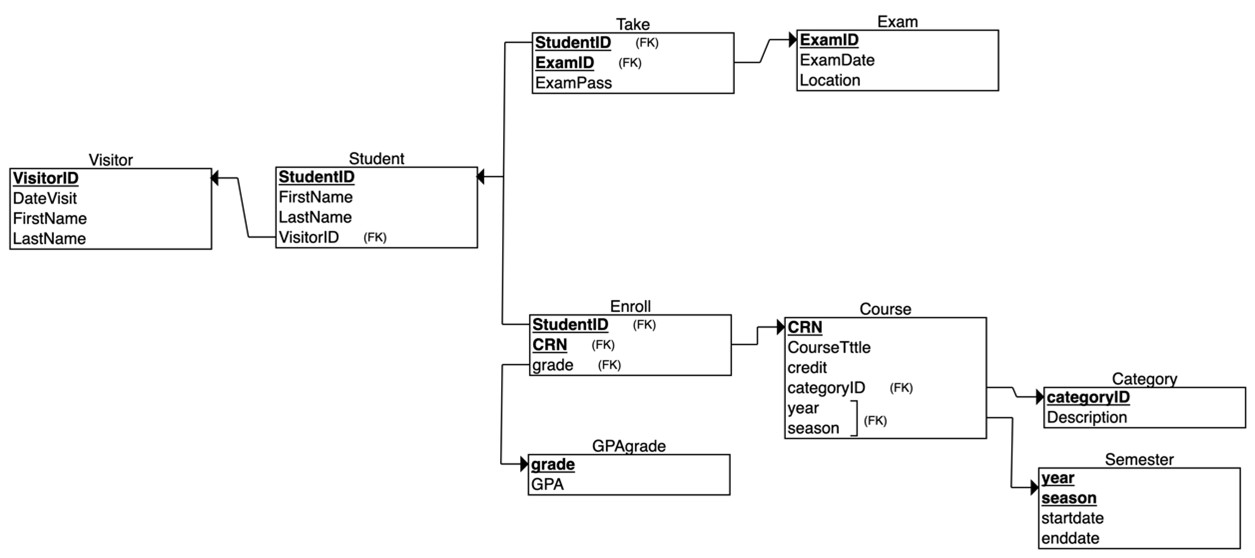
- We decided to create a new table to store grades and their corresponding GPA values. This is because including the GPA value in the student_course associative entity would be a functional dependency so to normalize the entity, we created a mapping table.
- Every course has a course description associated with it (except core courses). If we included them all in the courses database, we would run into an anomaly if these were to change. Instead, we created a foreign key (ID) and linked it to a separate entity.
- It is important for the university to track how its students do on the certification exam. In order to track this, we created a separate exam entity. This is different from the other exams because it is offered by a separate agency, not the university.
- The university offers exams before and after the internship. The exam offered before the internship is called the Comprehensive Exam. The one after is the Graduation exam.
- The exam after the internship is stored in the database as Graduation exam. The grade from this course will be the grade from the post-internship exam.
- The grade from before the internship (the comprehensive exam) is a separate class by itself.
- These were already how the university stored these exam grades so we decided to work with it.
- Similar to most other universities, the CRN is a code that is unique to every section across all years. CRNs will never be repeated once used.
4. Queries
Purpose of Queries: The purpose of using query is to manage students efficiently. CUSV managed students, course information, and exam passing rate manually. However, by using proper database and querying practices, we helped them manage students easily. CUSV also wanted to track and manage how many visitors end up enrolling in the institution (similar to managing a marketing funnel). We created a visitor entity and matched the visitorID to the student table, making this task easier.
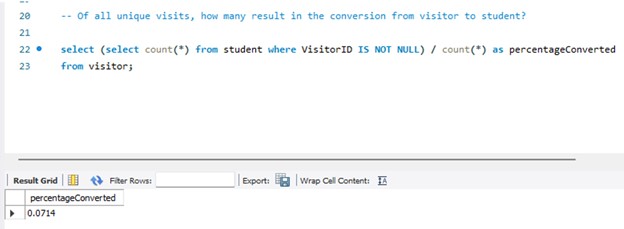
- The percentage of visitors that convert into students: The client wants to track conversion rate to see how effective student visits are. The client will be able to track how various promotions impact the conversion rate.
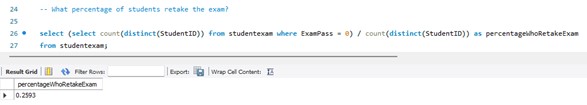
- The rate at which students retake the certificate exam: Understanding how frequently students fail exams will show whether or not there is a problem that needs addressing. Currently, one in every four students will fail the state certification exam, something that may spur some action from the client to improve pass rates.
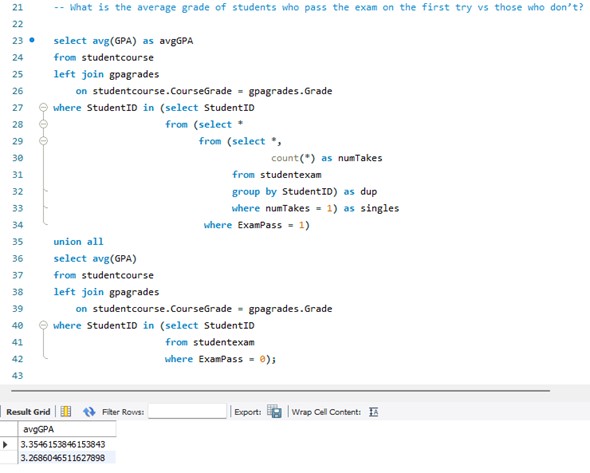
- Top – Average GPA of students who pass the exam on the first try. Bottom – Average GPA of students who fail the certification exam: The average GPA of students who fail the certificate exam at least once is lower than the average GPA of students who pass on the first try. This might help the client identify those students who are at greatest risk of failing the certificate exam.
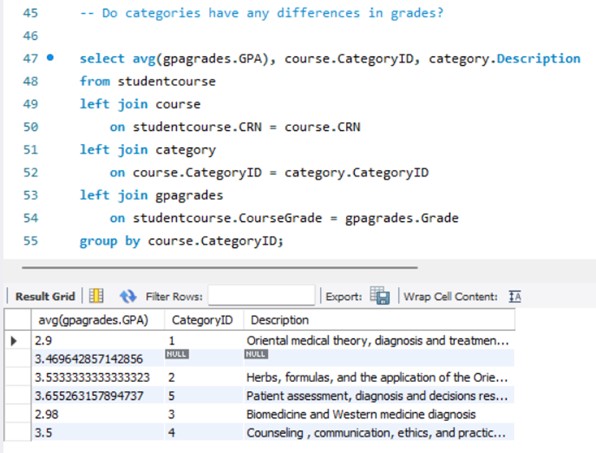
- Breakdown of average GPA by category: There is significant variation in grades between categories – the client is now aware that there are factors that affect students’ grades outside of just their dedication to studying.
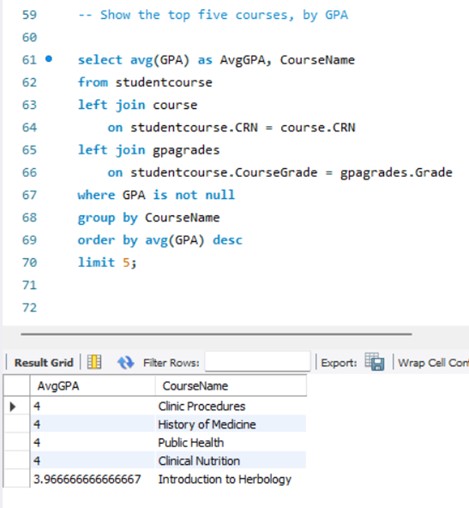
- GPA of the top five courses, by highest GPA: This indicates that there are quite a few courses that seem very easy and/or are taught exceptionally well. This is a factor in students’ grades.
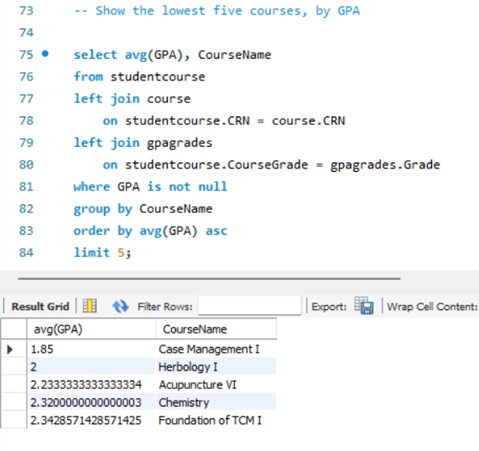
- GPA of the lowest five courses, by lowest GPA: This query, combined with the above query, shows that there is great difference between courses in terms of average GPA. This should be something that the client considers when deciding how to improve coursework (whether to make it better or to get a better instructor) and when assessing which students are at risk of not graduating the program and passing the state certificate exam.
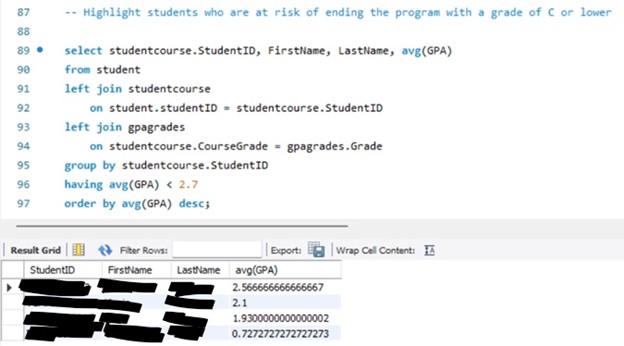
- A table of all students who have a grade of C or lower: In order to pass the program, a student has to have a cumulative GPA greater than a C. The above students should be supported in their effort to complete coursework and pass the state certification exam.
- Top number – Average GPA of students who visited the university before enrolling. Bottom number – Average GPA of students who did not visit the university before enrolling: Considering that GPA is an indicator of a student’s likelihood of passing the state exam, the fact that a student was a visitor before enrolling is an incredibly strong predictor of success within the program. The client should consider what factors may make this fact reality and decide whether a strategy of enrolling more visitors should be implemented.
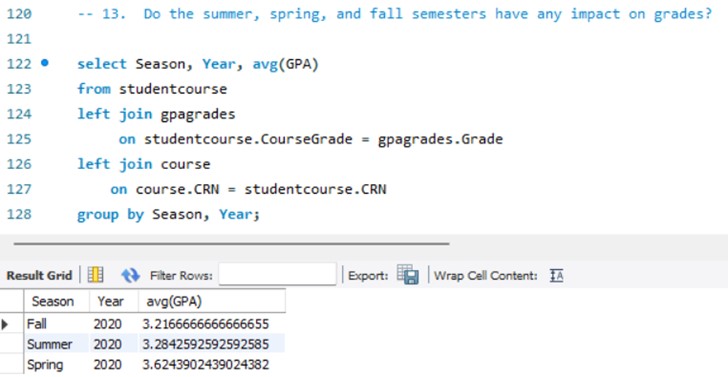
- The average GPA for each of the summer, spring, and summer semesters present so far in the database: The above query highlights another factor in student GPA’s – spring courses tend to produce much higher grades than fall and summer courses.
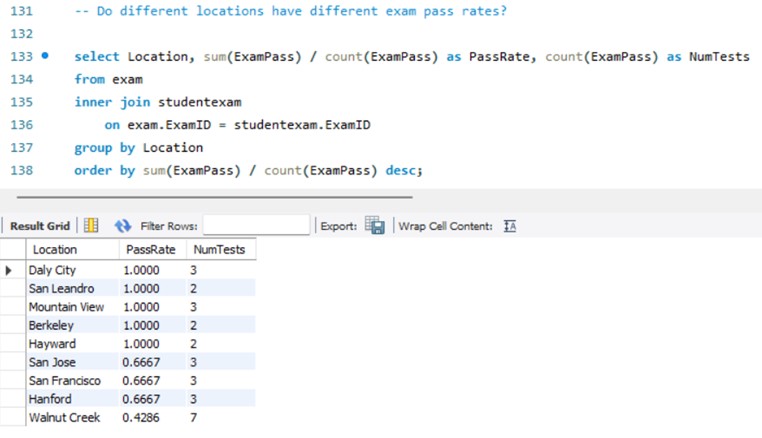
- An ordering of location of certificate examinations, by pass rate (descending): Since the university is concerned with pass rates for its students, it will be interested in seeing that some test sites show a greater pass rate than others, and that the most popular test site is the one with the lowest test rate.
5. Business Insights and Recommendations
[Exam]
- The current certificate pass rate is 74%, including the students who took the exam multiple times. The university needs to store data of students with different number of exam taken separately.
- At least a quarter of the students take the exam several times.
- Those who fail the exam tend to have lower grades. Current students with a GPA lower than 3.27 should be taken care of.
-
Pass: 3.35 Fail: 3.27
-
- Pass rates tend to be different based on exam sites. However, because of the small number of samples, this number may have been distorted. Nevertheless, the university should keep track of this metrics so that it can help the students benefit.
[Enrollment]
- The current enrollment rate is 7%.
- Students who visited have an average GPA of 3.74, whereas students who did not have an average GPA of 3.31. It is because of the consulting service that the university provides to students who visit the university. The university should have more students to go through the visiting stage.
[Student Management]
- Categories of courses have widely differing average grades.
-
Medical Theory: 2.9 Patient Assessment: 3.6
-
- We were able to identify students who are at risk of not completing the program.
- Below C rate: 13% or 4 students
R Shiny App - Wine Recommender
Text Classification for Proper Categorization of Postings